Fig. 10.
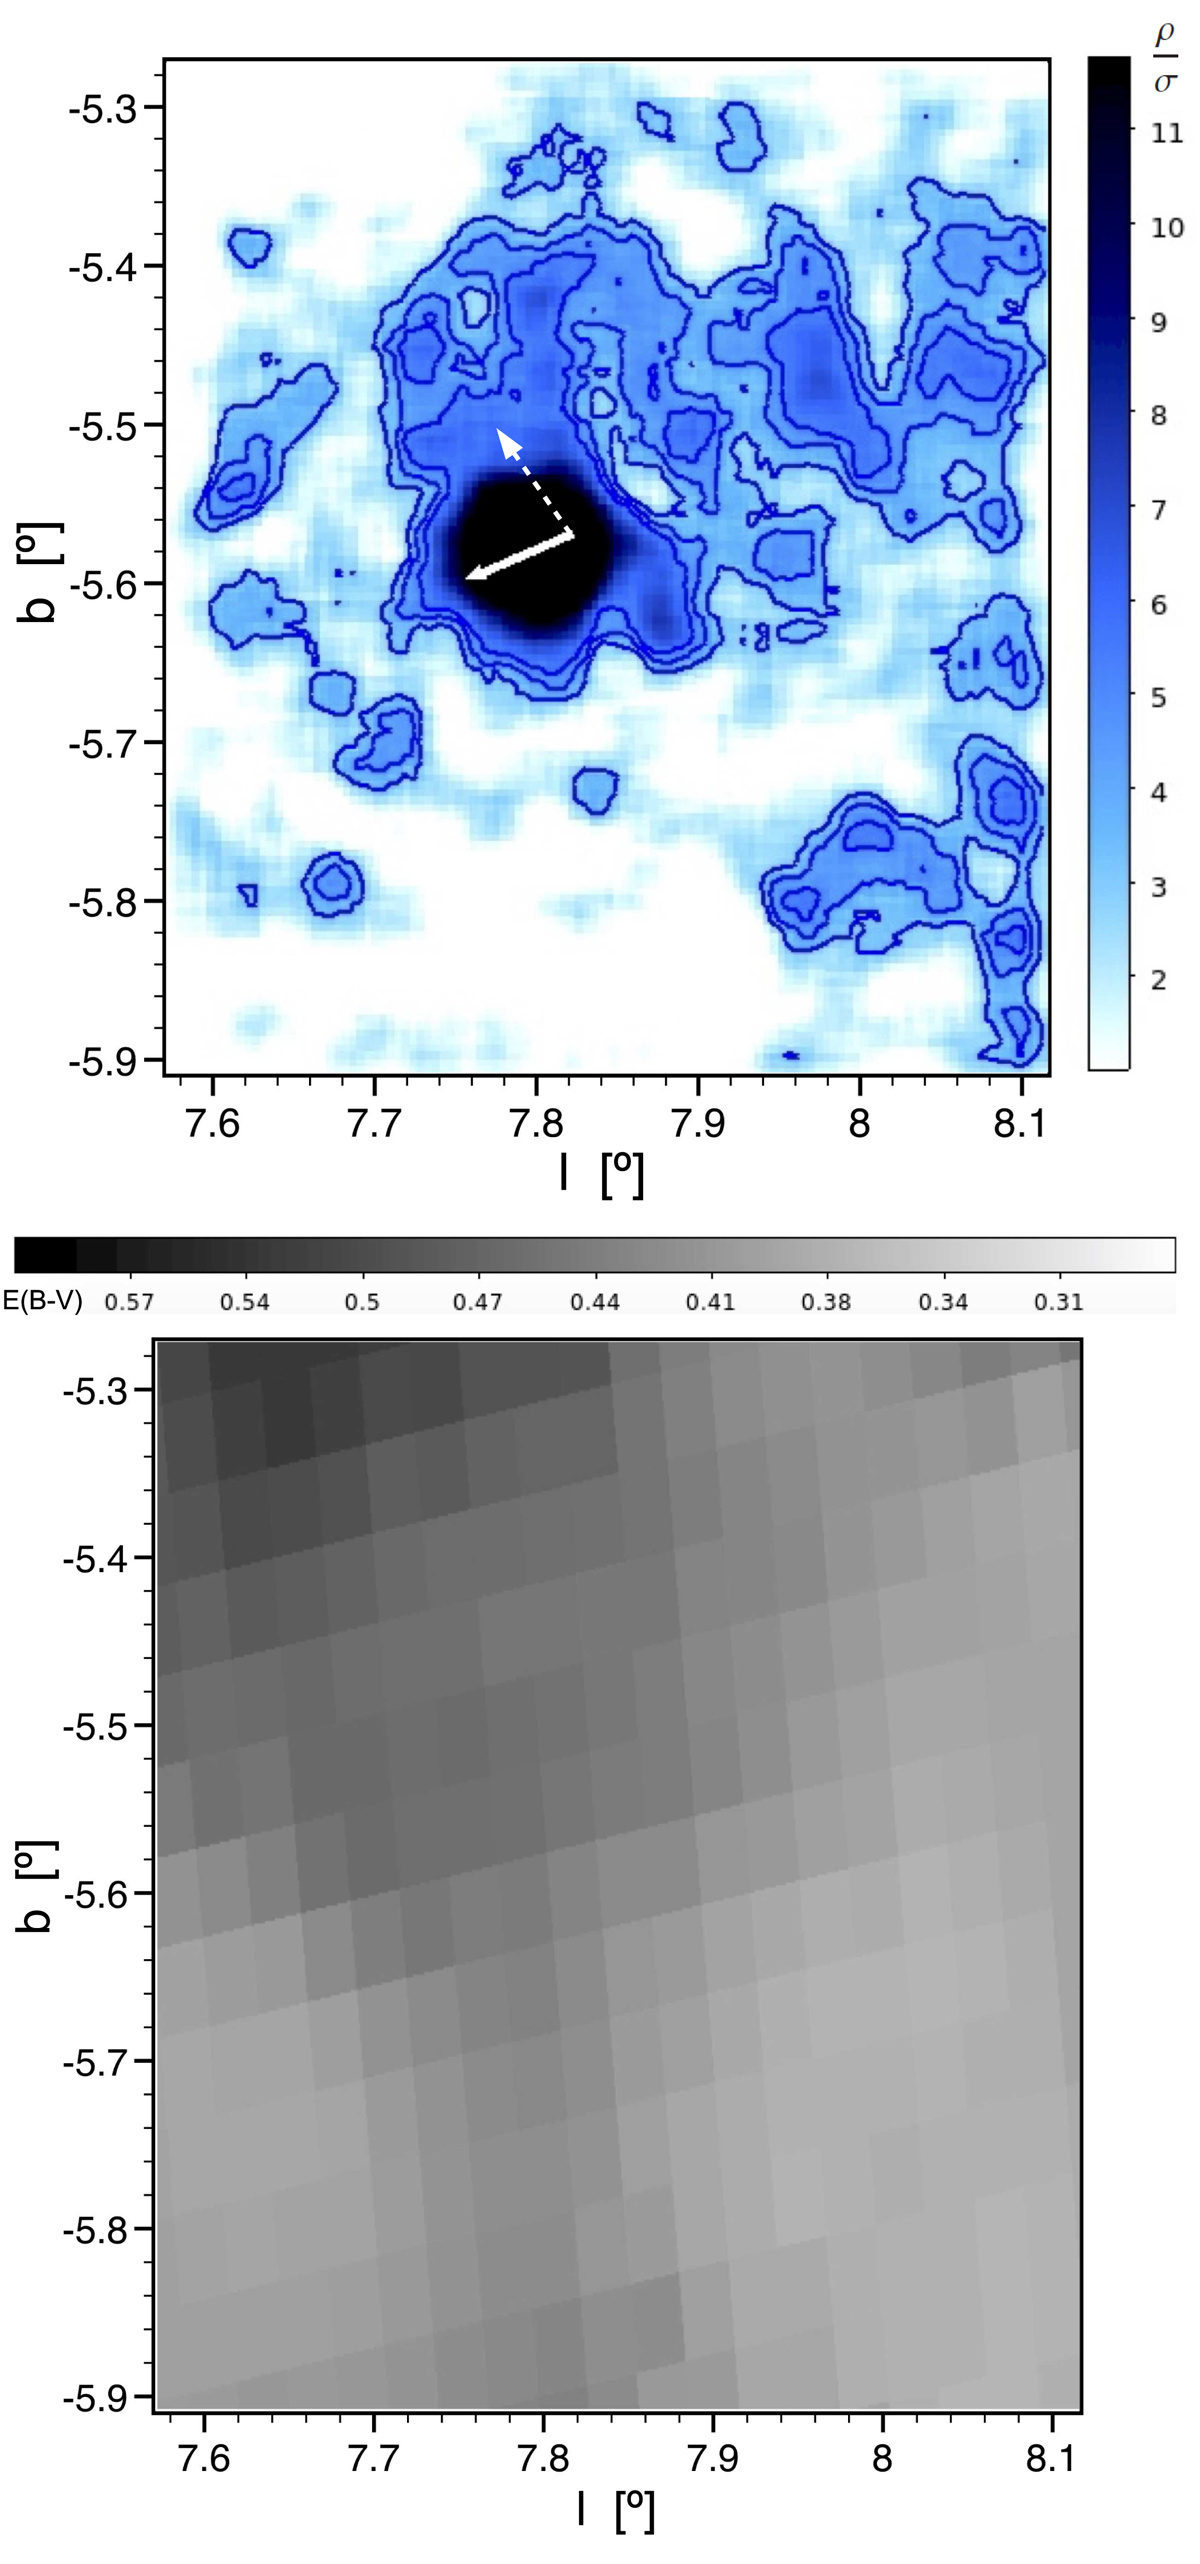
Upper panel: normalised background-subtracted density map of the cluster area, in units of the background noise (σ). Contour levels are shown at 3σ, 4σ, and 5σ. The full white arrow shows the direction of the cluster proper motion, while the dashed arrow points toward the Galactic centre. Lower panel: Schlegel et al. (1998) reddening map of the same area as the upper panel. The reddening values in the greyscale bar are given in E(B − V).
Current usage metrics show cumulative count of Article Views (full-text article views including HTML views, PDF and ePub downloads, according to the available data) and Abstracts Views on Vision4Press platform.
Data correspond to usage on the plateform after 2015. The current usage metrics is available 48-96 hours after online publication and is updated daily on week days.
Initial download of the metrics may take a while.