Fig. 4.
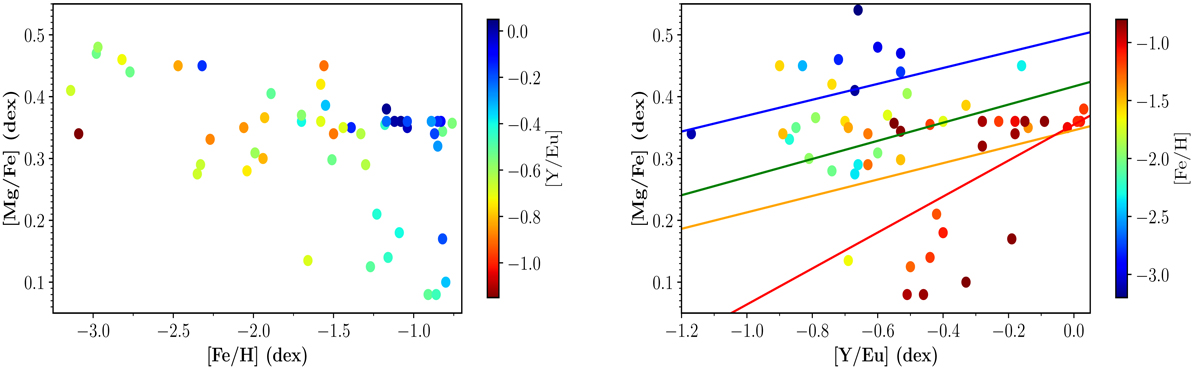
Control group of Milky Way objects with available Fe, Mg, Y, and Eu abundances. Left panel: Mg abundance with respect to iron as a function of [Fe/H] for the Milky Way sample stars with available estimates of [Y/Eu] abundance (included in the colour bar). Right panel: [Mg/Fe] as a function of [Y/Eu] the same Milky Way control group, colour coded by the [Fe/H] abundance. The linear correlations between [Mg/Fe] and [Y/Eu] in four metallicity intervals (less than [Fe/H] = −2.1 dex, between −2.1 dex and −1.5 dex, between −1.5 dex and −1.1 dex, and above [Fe/H] = −1.1 dex) are included as solid lines, following the [Fe/H] abundance colour code.
Current usage metrics show cumulative count of Article Views (full-text article views including HTML views, PDF and ePub downloads, according to the available data) and Abstracts Views on Vision4Press platform.
Data correspond to usage on the plateform after 2015. The current usage metrics is available 48-96 hours after online publication and is updated daily on week days.
Initial download of the metrics may take a while.