Free Access
Fig. 8
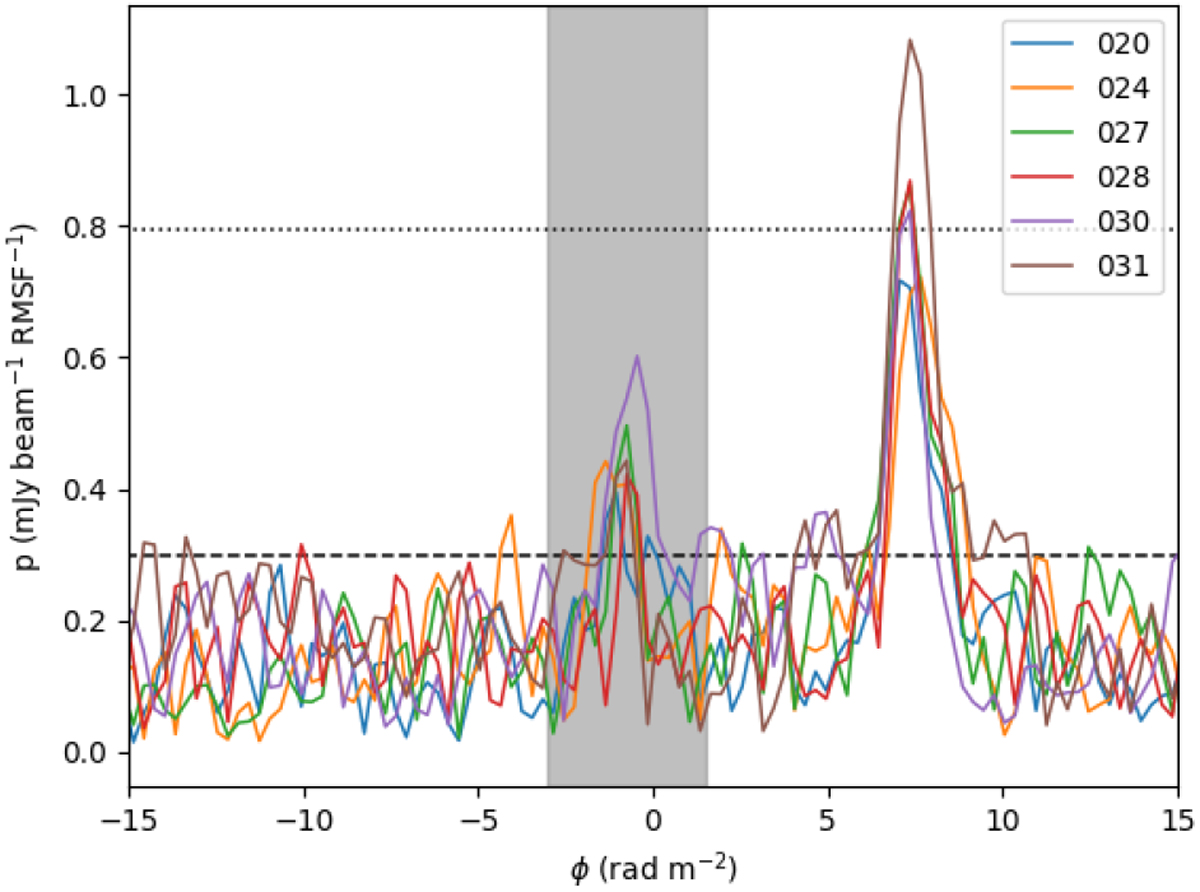
Faraday spectra of source 09 for each epoch. The dashed and dotted black horizontal lines represent the 3σQU and 8σQU levels, respectively (see text for details). The vertical gray area represents the range around ϕ = 0 rad m−2 excluded from the analysis due to instrumental polarization.
Current usage metrics show cumulative count of Article Views (full-text article views including HTML views, PDF and ePub downloads, according to the available data) and Abstracts Views on Vision4Press platform.
Data correspond to usage on the plateform after 2015. The current usage metrics is available 48-96 hours after online publication and is updated daily on week days.
Initial download of the metrics may take a while.