Fig. 7
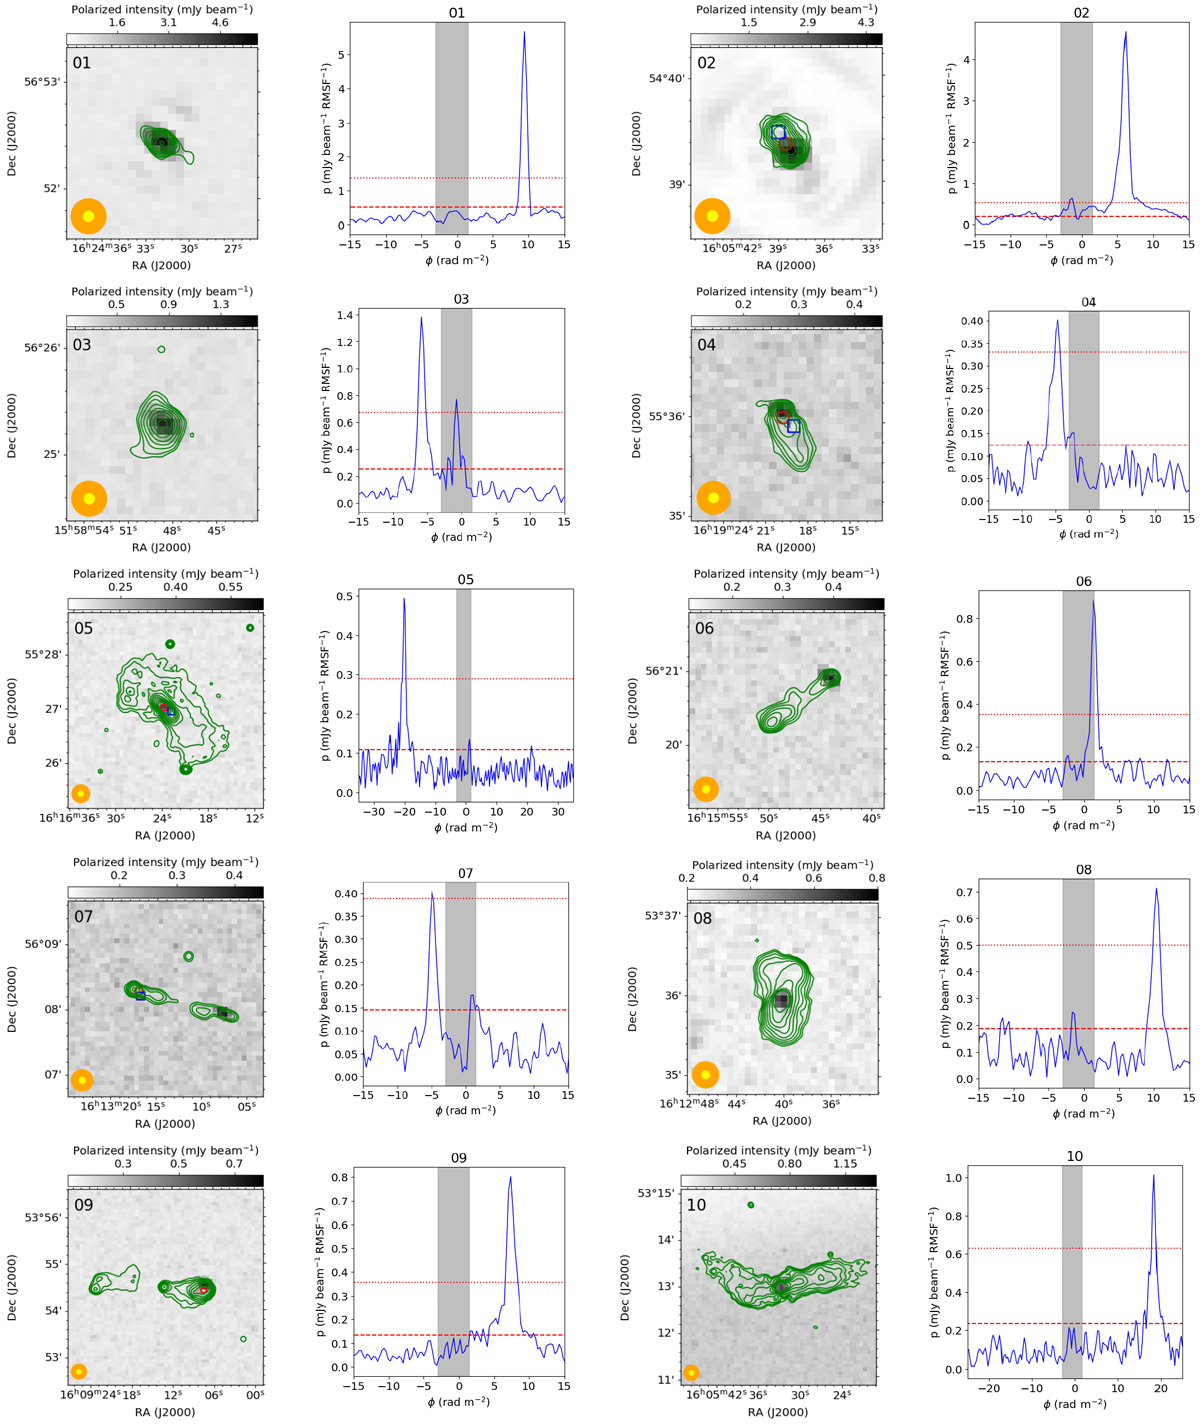
Polarized intensity maps with overlaid Stokes I contours (green) and Faraday spectra of the LOFAR detected polarized sources. The orange and yellow circles in the bottom left corners represent the synthesized beam of the observations in polarization (20′′) and in Stokes I (6′′), respectively. The Stokes I contours start either at 55σI or 20σI and increase by factors of two, or at 10σI and increase by factors of ![]() (see text for details). The blue square and red circle plotted on some of the polarized intensity maps represent the locations of the polarized sources detected at 1.4 GHz by Taylor et al. (2007) and Grant et al. (2010), respectively. The dashed and dotted red horizontal lines plotted on the Faraday spectra represent the 3σQU and 8σQU
levels, respectively. The vertical gray area encloses the excluded area in Faraday depth to avoid instrumental polarization leakage, sometimes visible as lesser peaks within this range.
(see text for details). The blue square and red circle plotted on some of the polarized intensity maps represent the locations of the polarized sources detected at 1.4 GHz by Taylor et al. (2007) and Grant et al. (2010), respectively. The dashed and dotted red horizontal lines plotted on the Faraday spectra represent the 3σQU and 8σQU
levels, respectively. The vertical gray area encloses the excluded area in Faraday depth to avoid instrumental polarization leakage, sometimes visible as lesser peaks within this range.
Current usage metrics show cumulative count of Article Views (full-text article views including HTML views, PDF and ePub downloads, according to the available data) and Abstracts Views on Vision4Press platform.
Data correspond to usage on the plateform after 2015. The current usage metrics is available 48-96 hours after online publication and is updated daily on week days.
Initial download of the metrics may take a while.