Fig. 6
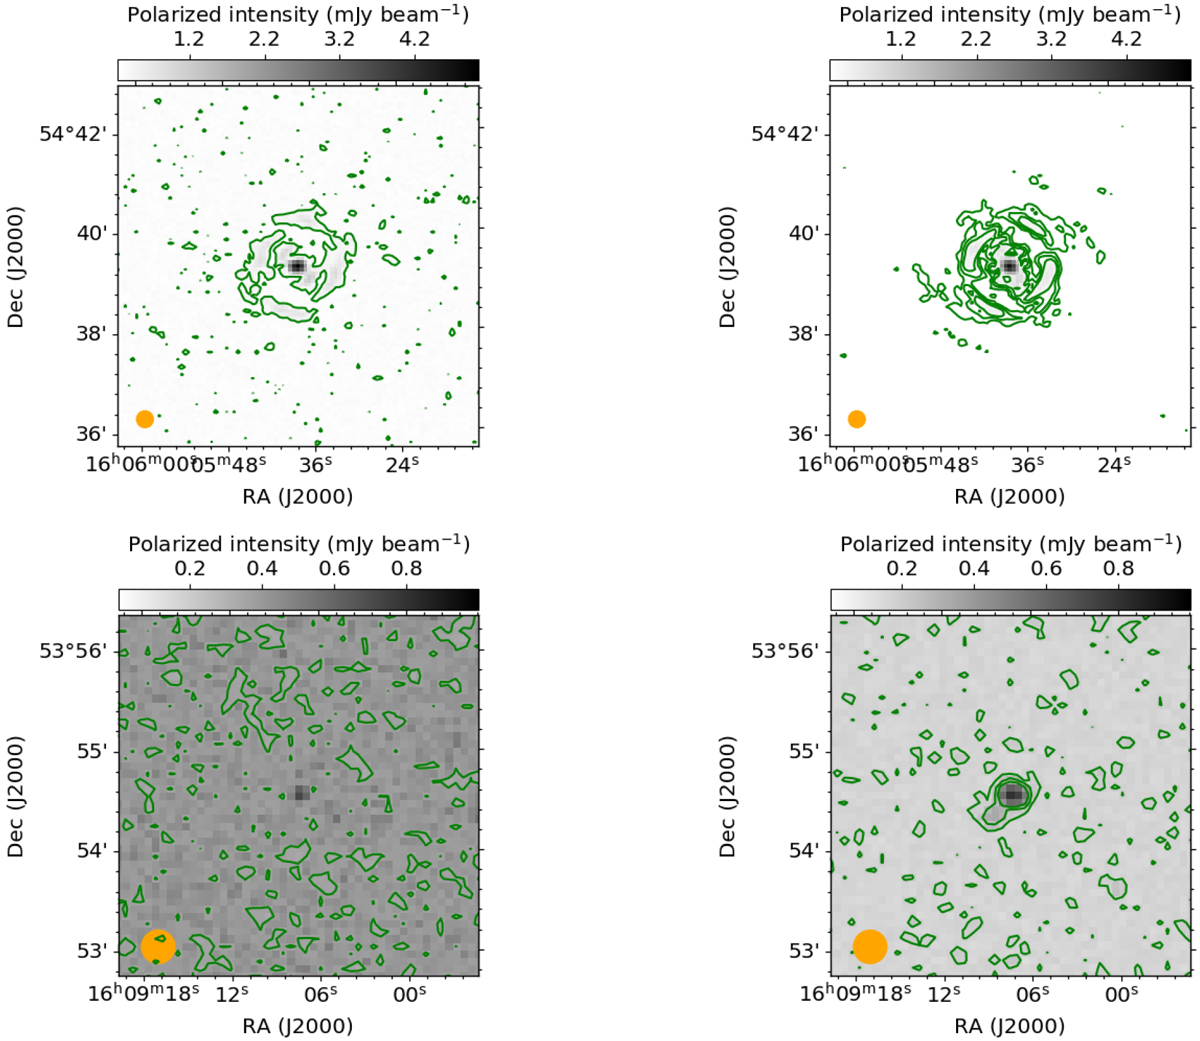
Polarized intensity map (not deconvolved) of the reference source (named 02, see text for details) (top panels) and of the source named 09 (bottom panels) before (left) and after (right) applying the stacking technique. Green contours showing the polarized intensity start at 3σQU,ref
and increase by factors of ![]() . The orange circles in the bottom left corners represent the synthesized beam FWHM of the polarization observations (20′′).
. The orange circles in the bottom left corners represent the synthesized beam FWHM of the polarization observations (20′′).
Current usage metrics show cumulative count of Article Views (full-text article views including HTML views, PDF and ePub downloads, according to the available data) and Abstracts Views on Vision4Press platform.
Data correspond to usage on the plateform after 2015. The current usage metrics is available 48-96 hours after online publication and is updated daily on week days.
Initial download of the metrics may take a while.