Fig. 1
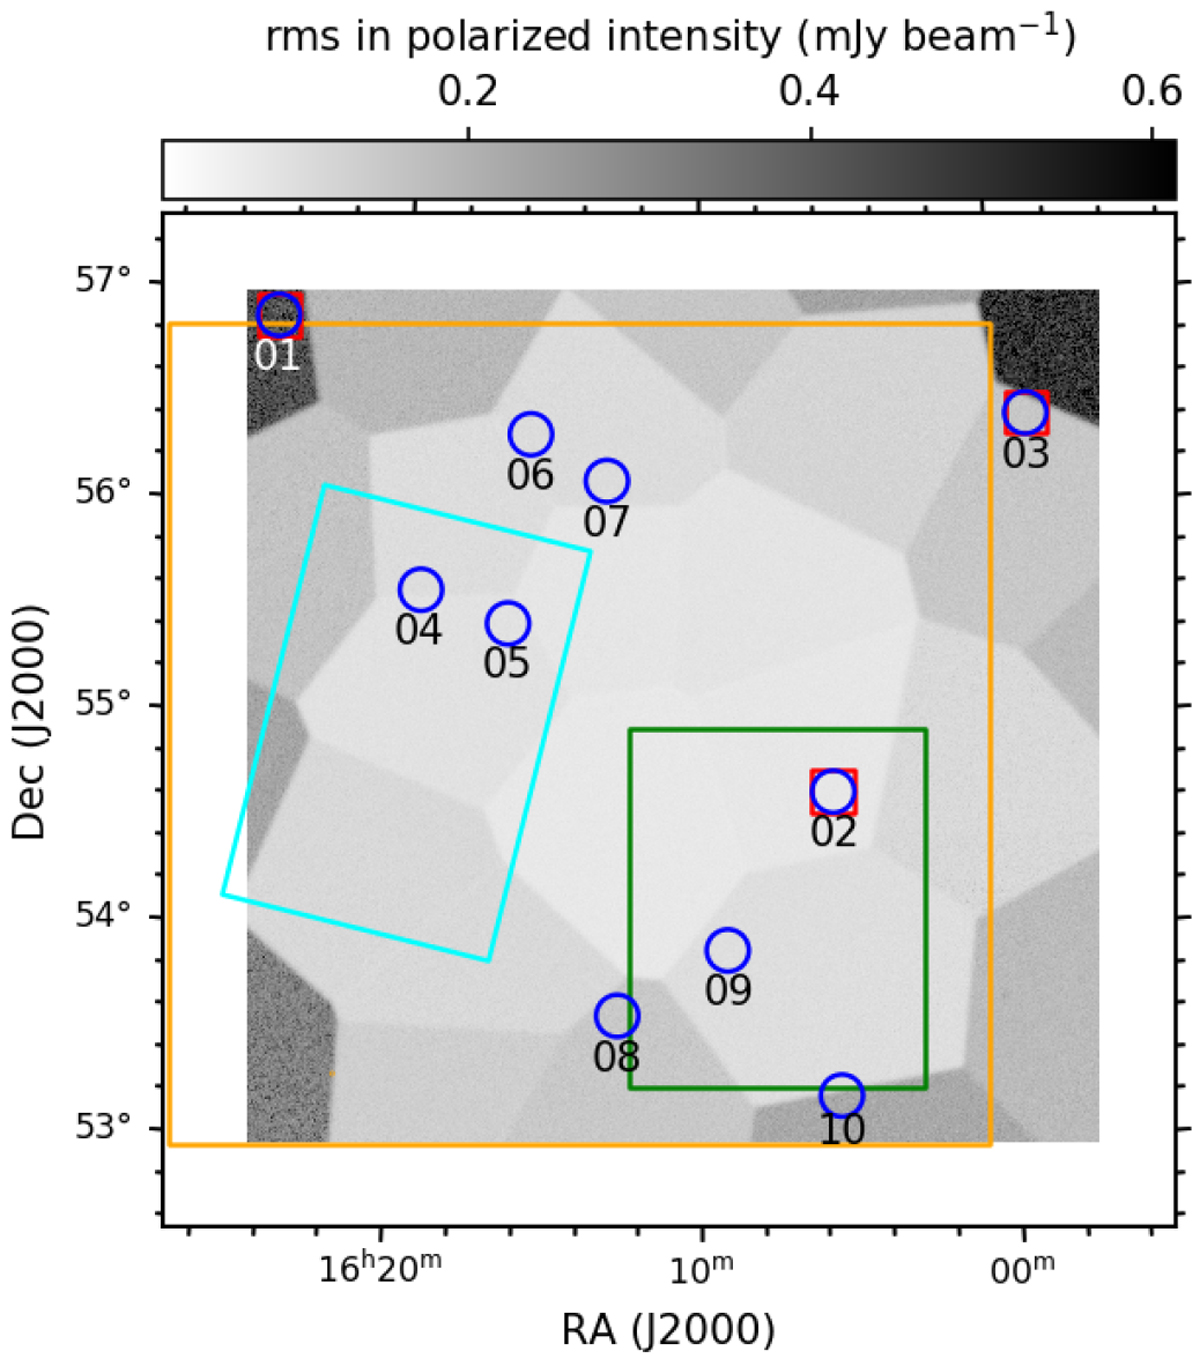
Grayscale image of the noise in the polarized intensity map from the epoch 024 observations of ELAIS-N1 at 114.9–177.4 MHz. The pattern seen is due to the facet layout used in the DDF-pipeline. The angular resolution of the observations is 20′′. The green square shows the region chosen to test our stacking technique (1.4 deg × 1.7 deg). The cyan square represents the ELAIS-N1 field originally defined by Oliver et al. (2000). The larger orange square represents the area imaged by Grant et al. (2010) at 1.4 GHz. The red squares represent the locations of the detected polarized sources in the epoch 024 data alone. The blue circles represent the locations of the detected polarized sources after using the stacking technique for the six epochs described in the text.
Current usage metrics show cumulative count of Article Views (full-text article views including HTML views, PDF and ePub downloads, according to the available data) and Abstracts Views on Vision4Press platform.
Data correspond to usage on the plateform after 2015. The current usage metrics is available 48-96 hours after online publication and is updated daily on week days.
Initial download of the metrics may take a while.