Fig. 7
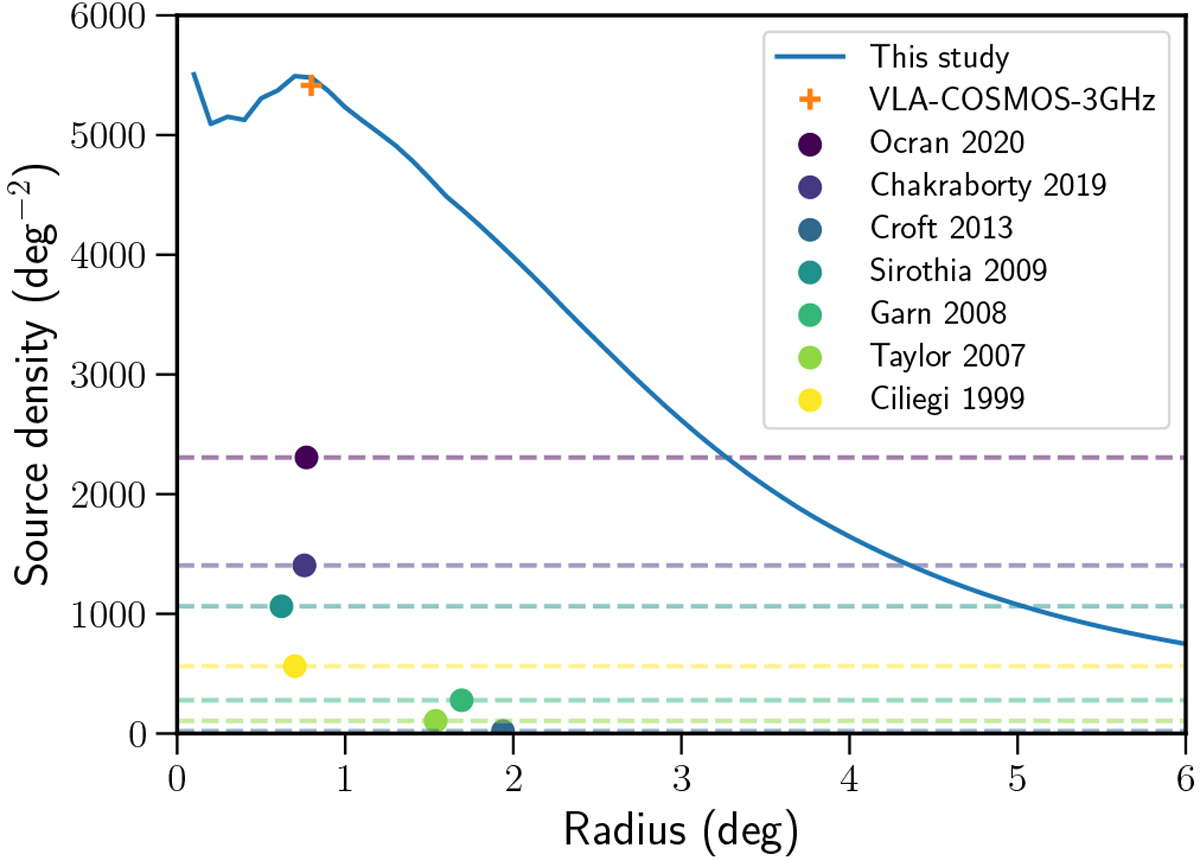
Comparison of the sky density of radio sources in our work with those quoted by other radio ELAIS-N1 surveys. The solid blue line shows the total density of sources at each radius for our study. The points show the density of sources quoted in the literature at the corresponding radius to the area covered by those surveys. The density is extended with dashed lines to give an idea of the radius out to which a similar average source density would be achieved with our data. We also show as a comparison the estimated sky density of VLA-COSMOS-3GHz (Smolčić et al. 2017) which reaches a comparable source density in the total 2 square degree area that it covers.
Current usage metrics show cumulative count of Article Views (full-text article views including HTML views, PDF and ePub downloads, according to the available data) and Abstracts Views on Vision4Press platform.
Data correspond to usage on the plateform after 2015. The current usage metrics is available 48-96 hours after online publication and is updated daily on week days.
Initial download of the metrics may take a while.