Fig. 6
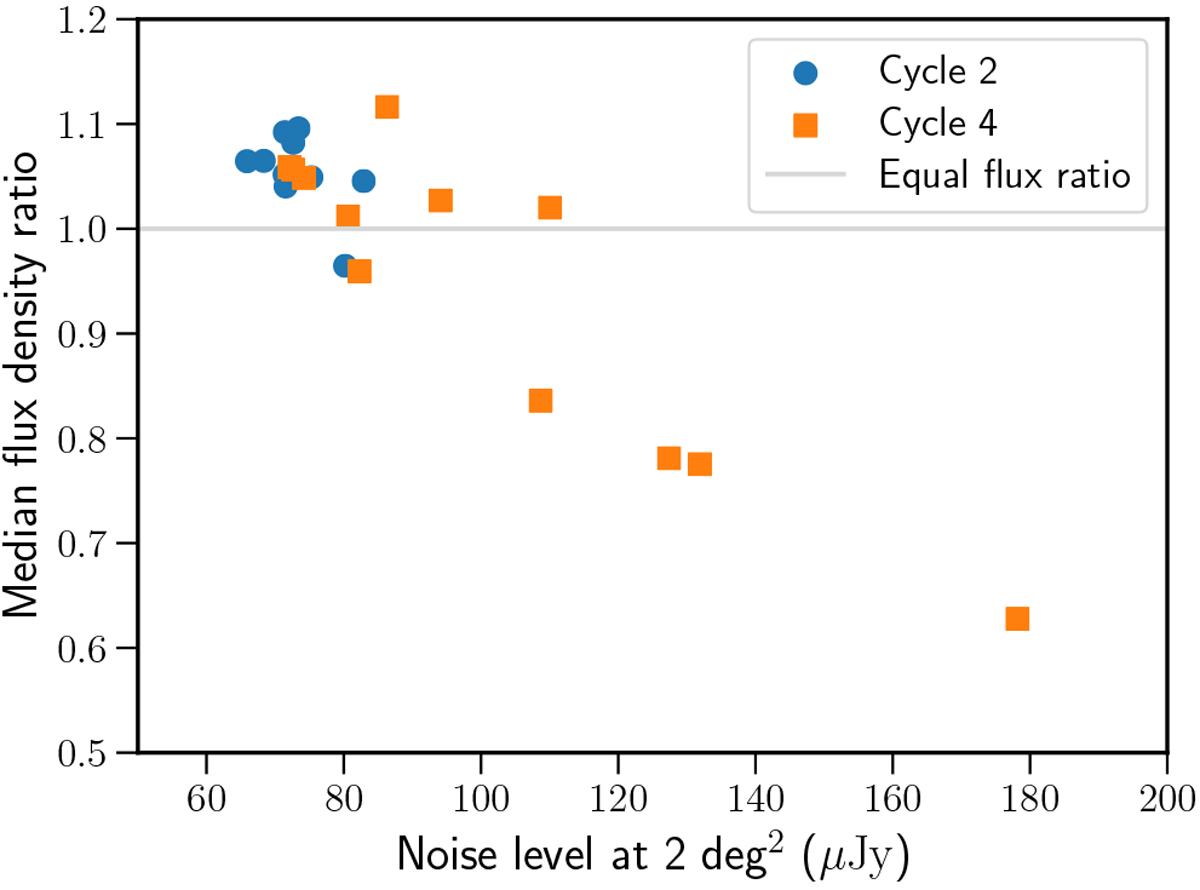
Relation between the deviation of the flux density ratio (observed over expected flux density) from the expected value and the noise level of each individual dataset. The vertical axis represents the median value of the flux density ratio distribution.The horizontal axis shows the noise level of the noise-area cumulative distribution at 2 square degrees. This value is a proxy for the calibration and data quality. Datasets of Cycle 2 are marked as blue circles and Cycle 4 as orange squares. The flux density ratios cluster around a line with value 1 (grey horizontal line) as expected but there is a clear inverse relation between flux density ratio and noise level.
Current usage metrics show cumulative count of Article Views (full-text article views including HTML views, PDF and ePub downloads, according to the available data) and Abstracts Views on Vision4Press platform.
Data correspond to usage on the plateform after 2015. The current usage metrics is available 48-96 hours after online publication and is updated daily on week days.
Initial download of the metrics may take a while.