Fig. 5
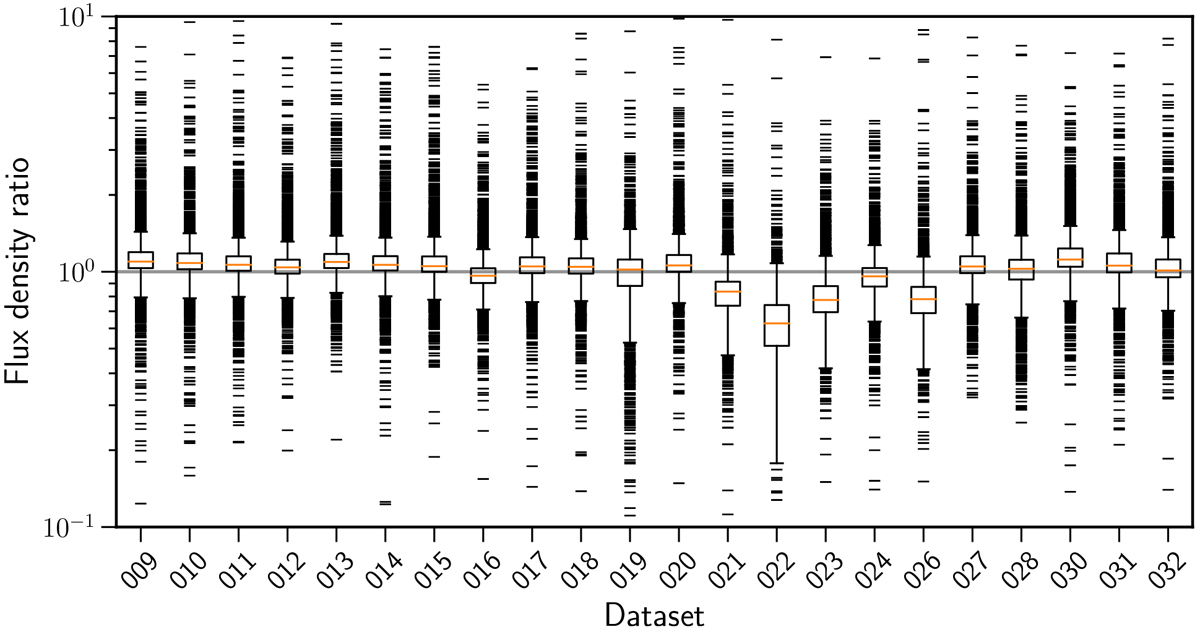
Distribution of the flux density ratio of the sources in common between the individual datasets and the final deep image. The distributions of the datasets are symmetrical in general in flux density scale but their median is systematically different from the expected value of 1. Figure 6 shows that the offsets are correlated with the noise level of the datasets.
Current usage metrics show cumulative count of Article Views (full-text article views including HTML views, PDF and ePub downloads, according to the available data) and Abstracts Views on Vision4Press platform.
Data correspond to usage on the plateform after 2015. The current usage metrics is available 48-96 hours after online publication and is updated daily on week days.
Initial download of the metrics may take a while.