Fig. 3
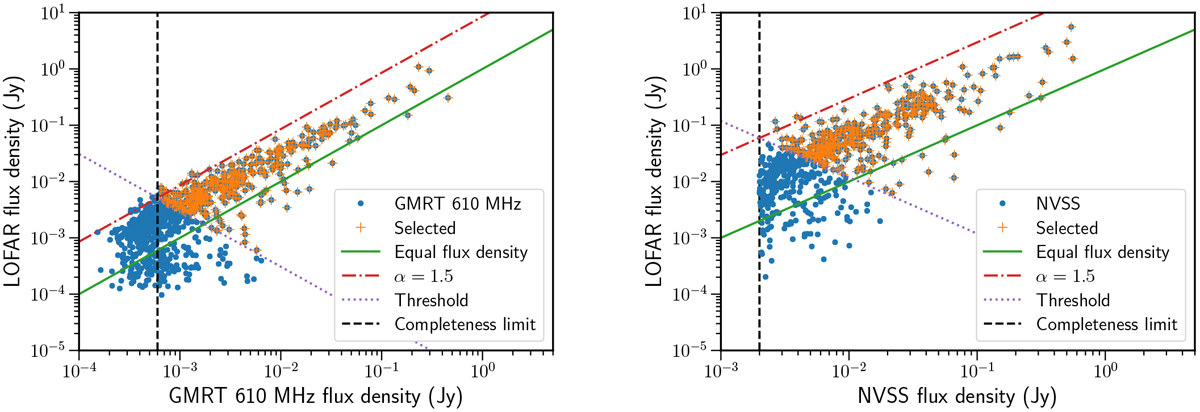
Selection of sources for the cross-match for the GMRT 610 MHz (left panel) and the NVSS (right panel) samples. All the cross-matched sources are shown as blue dots and the finally selected ones are marked with an orange cross. The completeness limit of the survey is shown as a vertical dashed line. The line at which the flux densities are equal is shown as reference as a solid green line. The locus of sources with a spectral index of 1.5 is shown as a dash-dotted red line. The point at which this line and the survey completeness line cross is used as a reference for the selection threshold in the product of flux densities (see text) which is marked as a purple dotted line.
Current usage metrics show cumulative count of Article Views (full-text article views including HTML views, PDF and ePub downloads, according to the available data) and Abstracts Views on Vision4Press platform.
Data correspond to usage on the plateform after 2015. The current usage metrics is available 48-96 hours after online publication and is updated daily on week days.
Initial download of the metrics may take a while.