Fig. 15
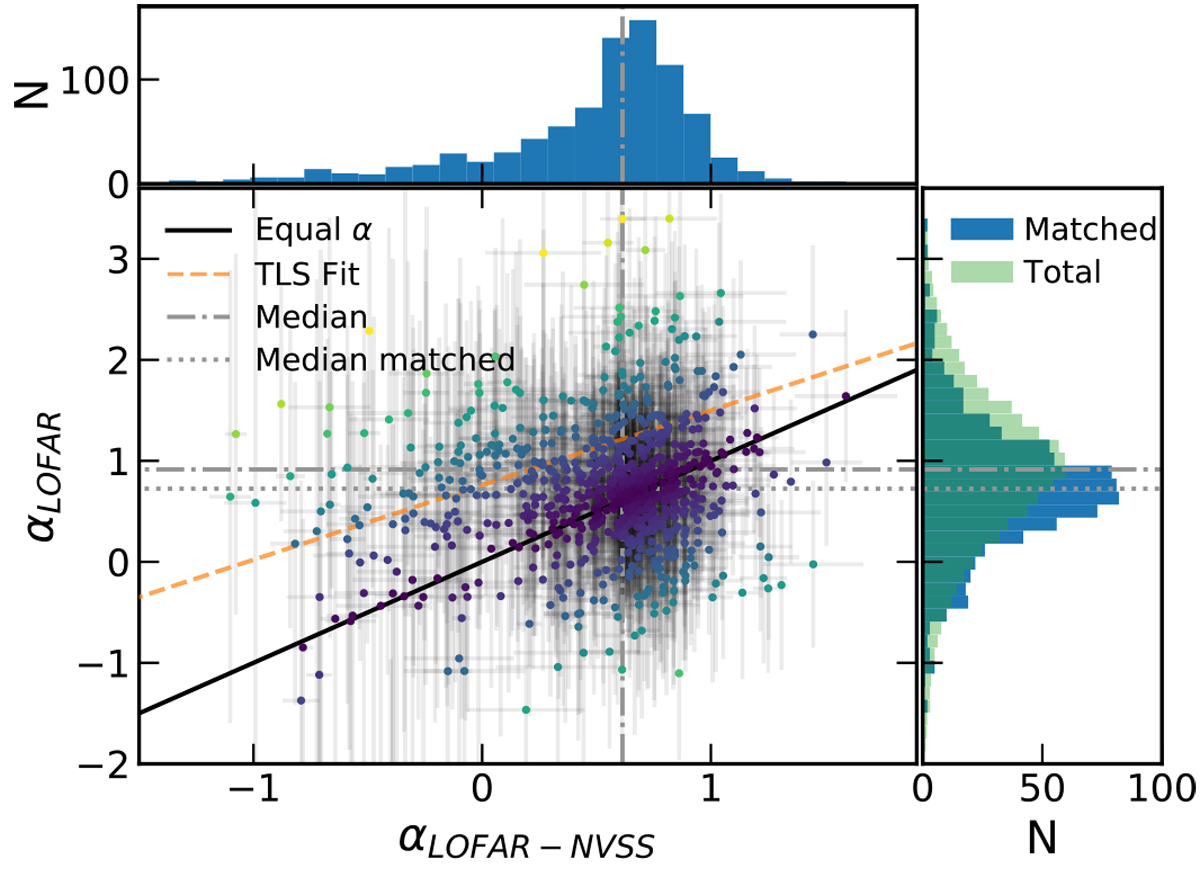
Comparison of the intra-band spectral index (αLOFAR) with the NVSS to LOFAR spectral index (αLOFAR-NVSS). The colour of the dots is proportional to the deviation from the (black solid) line where the spectral indices are equal. The errors are plotted as faint grey lines and indicate the 95 per cent confidence interval. The median of the distributions for all the sources are shown as grey dash-dotted lines. The median of the distribution of αLOFAR for the sources that were matched to NVSS sources is shown as a dotted line. The orange dashed line shows the total least squares fit to the distribution (see text). Upper panel: histogram with the distribution of αLOFAR-NVSS. Right panel: histogram with the distribution of αLOFAR for the cross-matched sources (blue) and for the total sample over-plotted (green).
Current usage metrics show cumulative count of Article Views (full-text article views including HTML views, PDF and ePub downloads, according to the available data) and Abstracts Views on Vision4Press platform.
Data correspond to usage on the plateform after 2015. The current usage metrics is available 48-96 hours after online publication and is updated daily on week days.
Initial download of the metrics may take a while.