Fig. 14
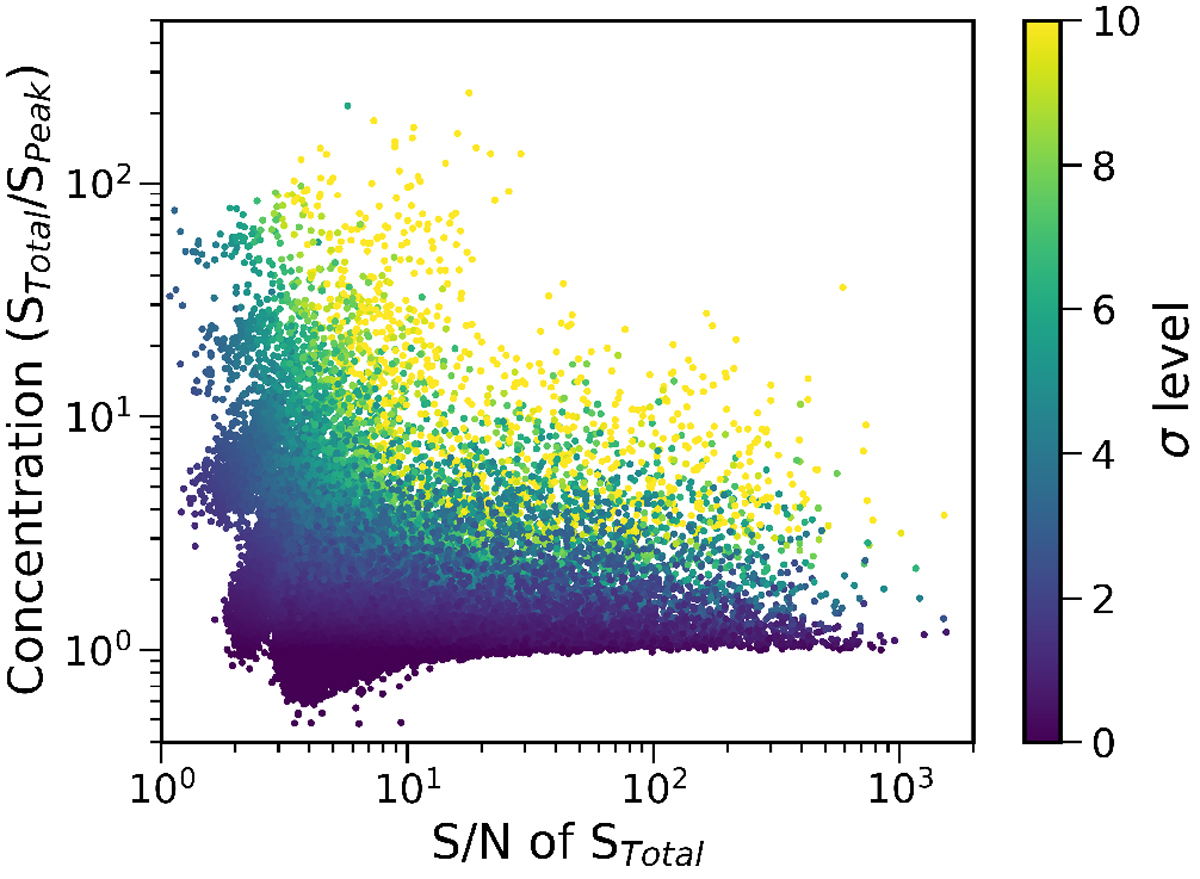
Diagram showing the location of extended sources. The concentration (total over peak flux density) is plotted with respectto the S/N of the total flux density. The colour scale represents the confidence level at which a source can be considered to be extended after also taking into account the radial location of the source in the field (see text for more details).
Current usage metrics show cumulative count of Article Views (full-text article views including HTML views, PDF and ePub downloads, according to the available data) and Abstracts Views on Vision4Press platform.
Data correspond to usage on the plateform after 2015. The current usage metrics is available 48-96 hours after online publication and is updated daily on week days.
Initial download of the metrics may take a while.