Fig. 12
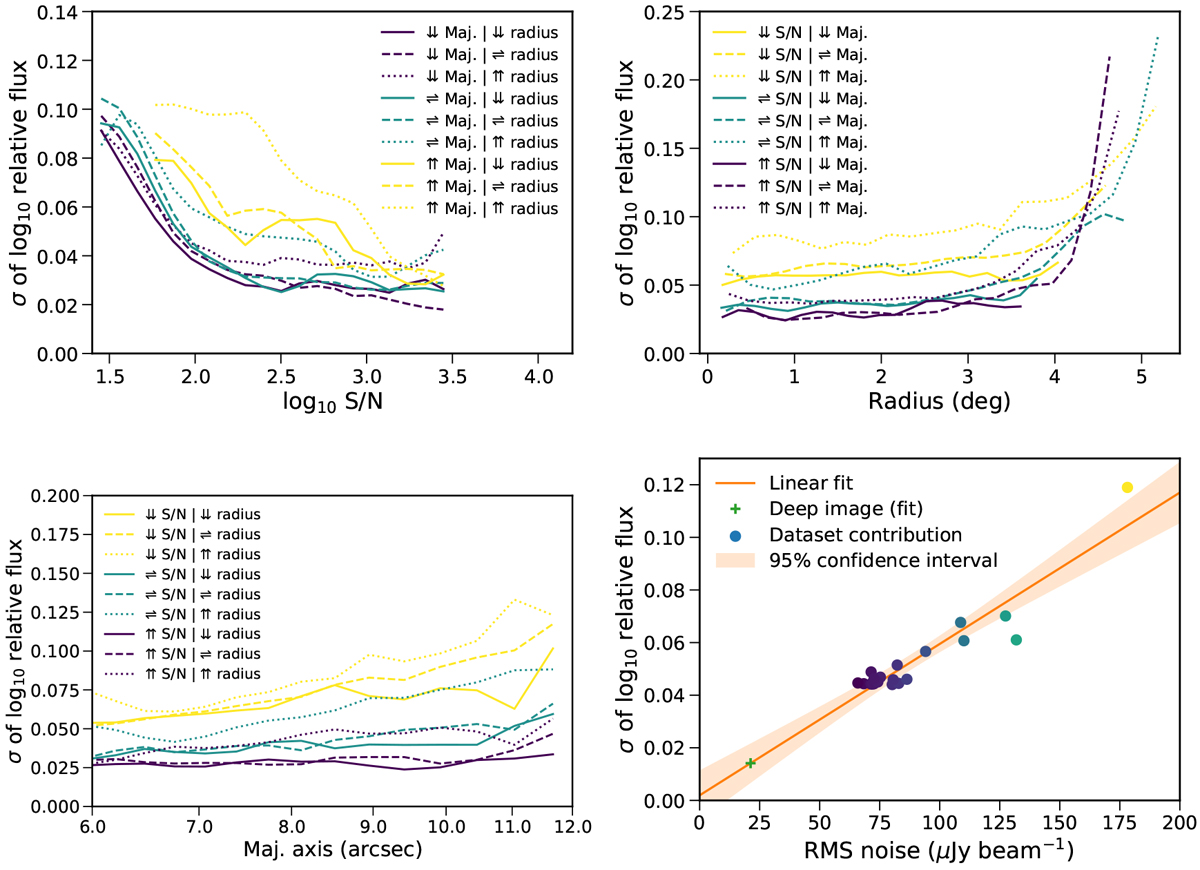
Standard deviation (σ) of the logarithmic relative flux density with respect to several parameters. Upper left panel: relation of σ with respect to the signal-to-noise level for sub-samples separated in terciles of distance from the pointing centre and major axis. The different terciles are marked with arrow symbols in the legend: up arrows for the higher tercile, left-right arrows for the middle tercile, and down arrows for the lower one. Upper right panel: relation of σ with respect to the distance to the centre for terciles of major axis and S/N. Lower left panel: relation of σ with respect to the major axis of the sources for terciles of distance to the centre and S/N. Lower right panel: contribution of the calibration effects of the dataset (σdataset, as explainedin the text) with respect to the rms noise at 2 square degrees for the individual datasets (coloured circles). The linear fit to the relation is shown as a orange line and its 95 per cent confidence interval as a shaded orange band. The extrapolated location of the final deep image is also marked in the diagram as a green cross.
Current usage metrics show cumulative count of Article Views (full-text article views including HTML views, PDF and ePub downloads, according to the available data) and Abstracts Views on Vision4Press platform.
Data correspond to usage on the plateform after 2015. The current usage metrics is available 48-96 hours after online publication and is updated daily on week days.
Initial download of the metrics may take a while.