Fig. 1
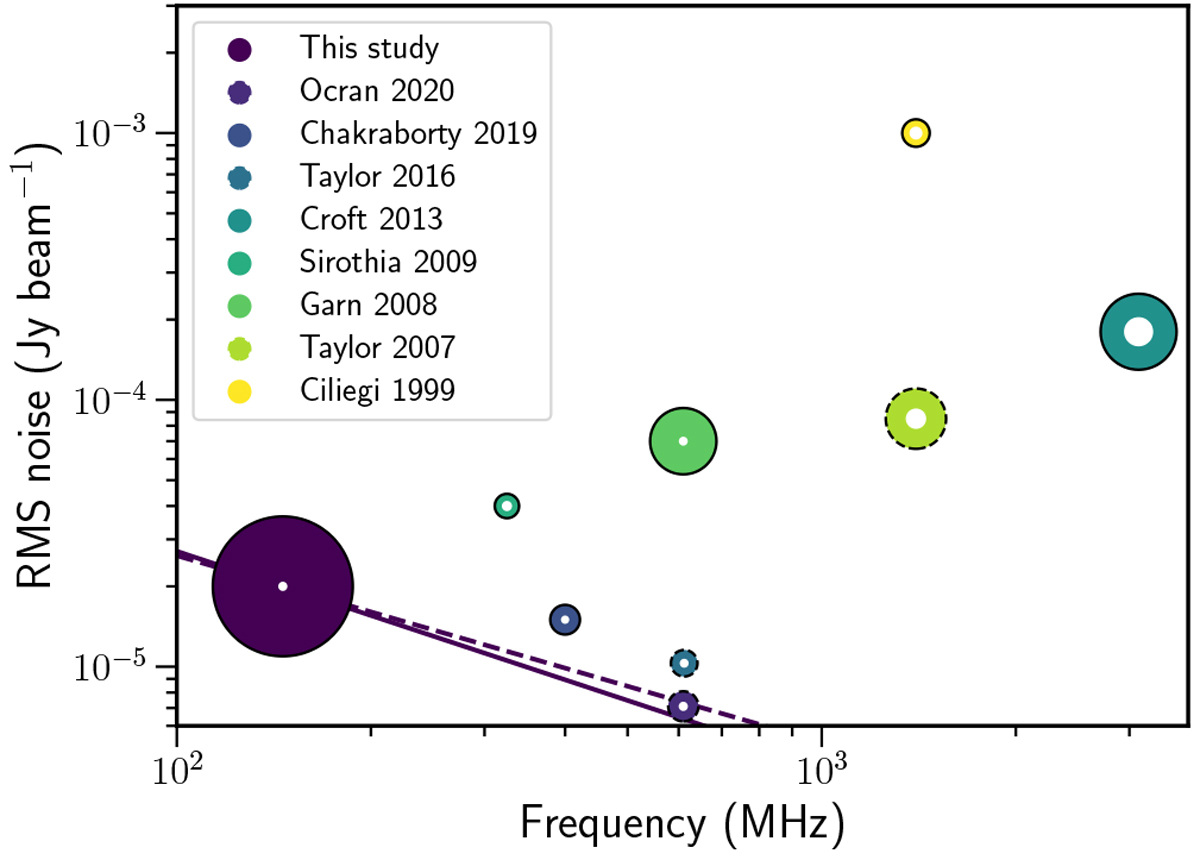
Depths and frequencies of radio surveys in the literature targeting the ELAIS-N1 field. The area of each circle is proportional to the area covered by the survey. The area of the inner dot is proportional to the resolution with smaller dots indicating better resolutions (ranging from 4.5 arcsecs up to 100 arcsecs). The data were not found to be publicly available for the observations outlined with a dashed line (those of Taylor et al. 2007; Taylor & Jagannathan 2016; Ocran et al. 2020). The solid line indicates a spectral index of 0.8 and the dashed line one of 0.7.
Current usage metrics show cumulative count of Article Views (full-text article views including HTML views, PDF and ePub downloads, according to the available data) and Abstracts Views on Vision4Press platform.
Data correspond to usage on the plateform after 2015. The current usage metrics is available 48-96 hours after online publication and is updated daily on week days.
Initial download of the metrics may take a while.