Fig. 9
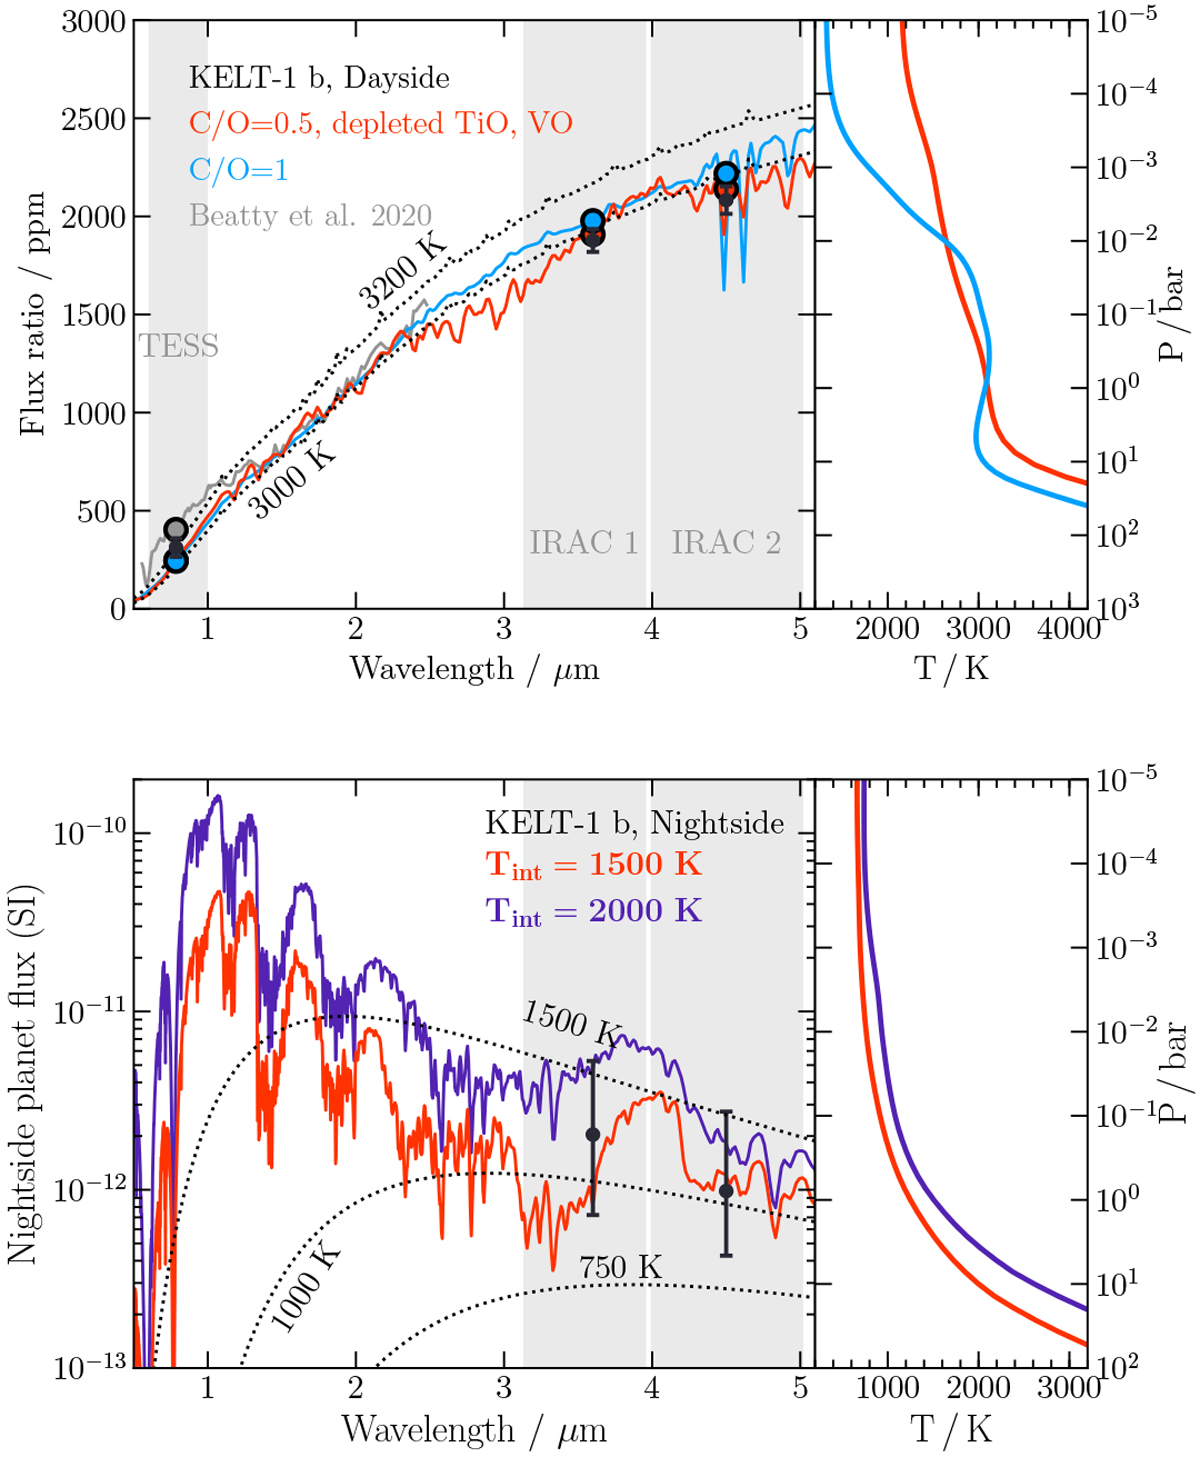
Self-consistent modeling of the atmosphere of KELT-1b. Top: model day-side spectra (left) and pressure-temperature (P-T) profiles (right), assuming solar metallicity and an internal temperature of 1500 K. The red spectrum and P-T profile correspond to a C/O=0.5 and depleted TiO/VO (e.g., due to gravitational settling), while the blue model corresponds to a C/O = 1. The black dashed lines correspond to blackbody spectra at 3000 and 3200 K. The cloudy, Tint = 1000 K model from Beatty et al. (2020) is shown in grey for reference. Bottom: model night-side spectra (left) and pressure-temperature profiles (right) for KELT-1 b assuming internal temperatures of 1500 K (red lines) and 2000 K (purple lines). Dashed black lines correspond to blackbody spectra at 750, 1000 and 1500 K. Flux is shown in SI units (W sr−1 m−3). In both panels, data are shown by black points and error bars. Coloured circles show the binned model spectra. Vertical gray bands show the TESS and Spitzer bandpasses.
Current usage metrics show cumulative count of Article Views (full-text article views including HTML views, PDF and ePub downloads, according to the available data) and Abstracts Views on Vision4Press platform.
Data correspond to usage on the plateform after 2015. The current usage metrics is available 48-96 hours after online publication and is updated daily on week days.
Initial download of the metrics may take a while.