Fig. 8
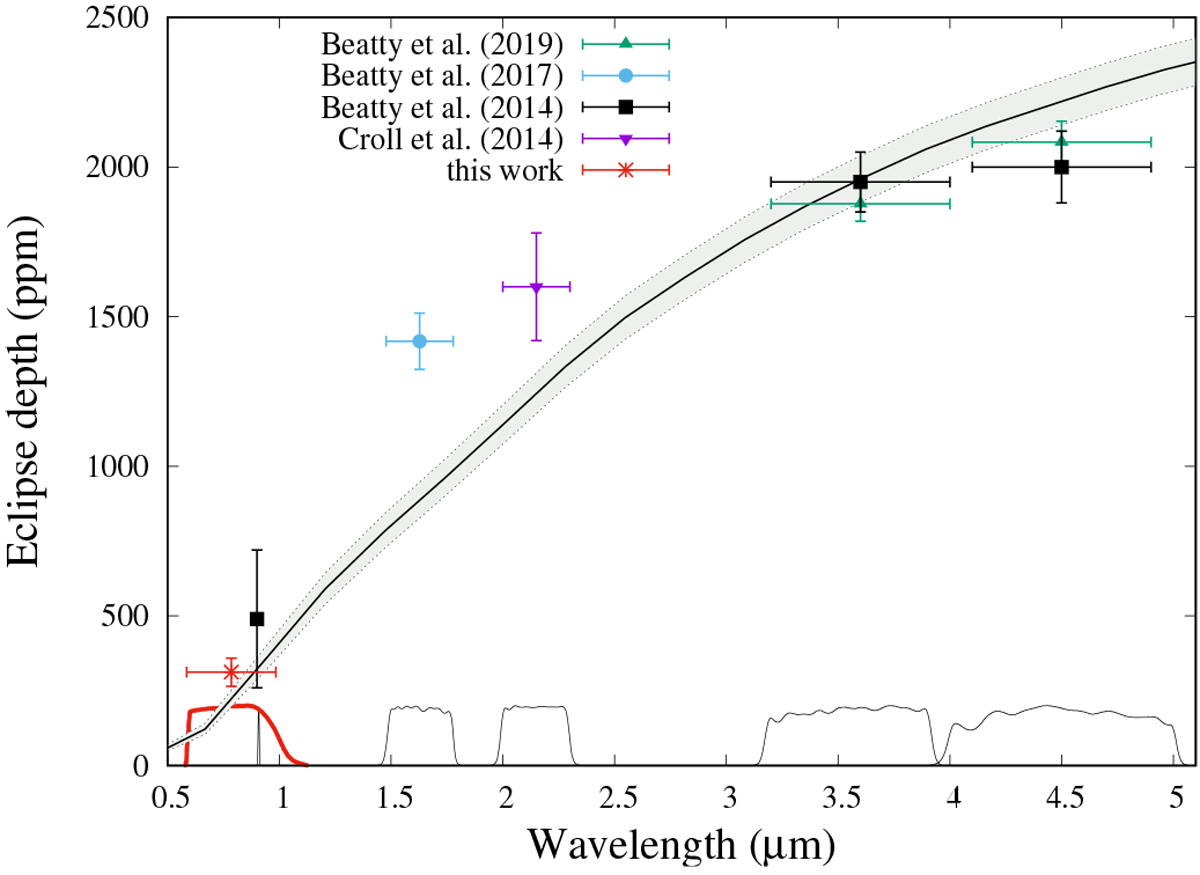
Eclipse depth, in ppm, as a function of wavelength. Literature values are taken from Croll et al. (2015); Beatty et al. (2014, 2017, 2019). Our new data point is plotted in red. The gray area shows a 1σ contour of the equilibrium temperature of KELT-1b, determined from all data. Transmission responses are plotted in black continuous lines, with the exception of TESS, highlighted in red.
Current usage metrics show cumulative count of Article Views (full-text article views including HTML views, PDF and ePub downloads, according to the available data) and Abstracts Views on Vision4Press platform.
Data correspond to usage on the plateform after 2015. The current usage metrics is available 48-96 hours after online publication and is updated daily on week days.
Initial download of the metrics may take a while.