Fig. 6
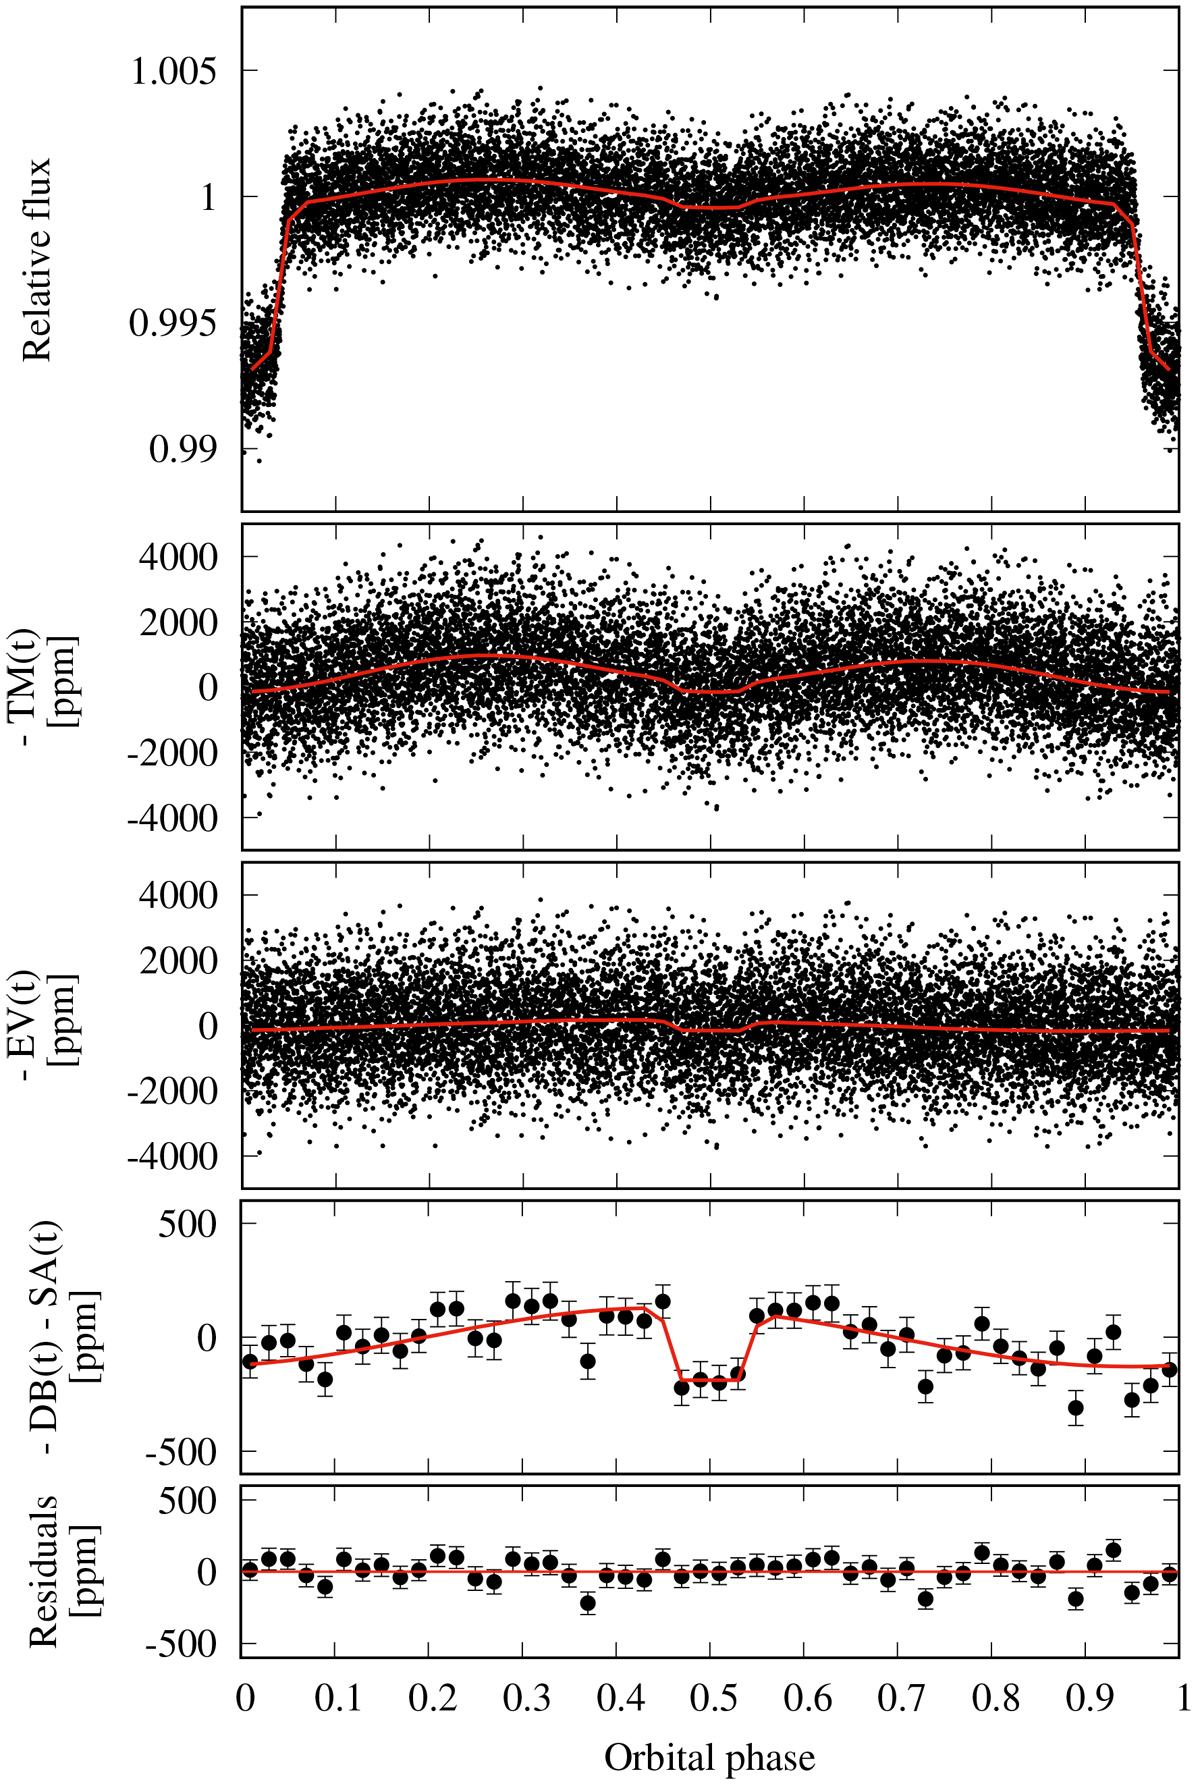
Data (black points) versus best-fit model (red continuous line) as a function of the orbital phase of KELT-1b. From top to bottom: full data set; same data, but with the best-fit primary transit, PT(t), removed; ellipsoidal variation, EV(t), removed; Doppler beaming and stellar activity, DB(t) and SA(t), respectively, removed, at which point the secondary eclipse and the phase curve are visible; residuals, once the secondary eclipse and the phase curve are removed. The last two panels are shown at a 0.02 orbital phase binning. The last four panels are given in ppm.
Current usage metrics show cumulative count of Article Views (full-text article views including HTML views, PDF and ePub downloads, according to the available data) and Abstracts Views on Vision4Press platform.
Data correspond to usage on the plateform after 2015. The current usage metrics is available 48-96 hours after online publication and is updated daily on week days.
Initial download of the metrics may take a while.