Fig. 5
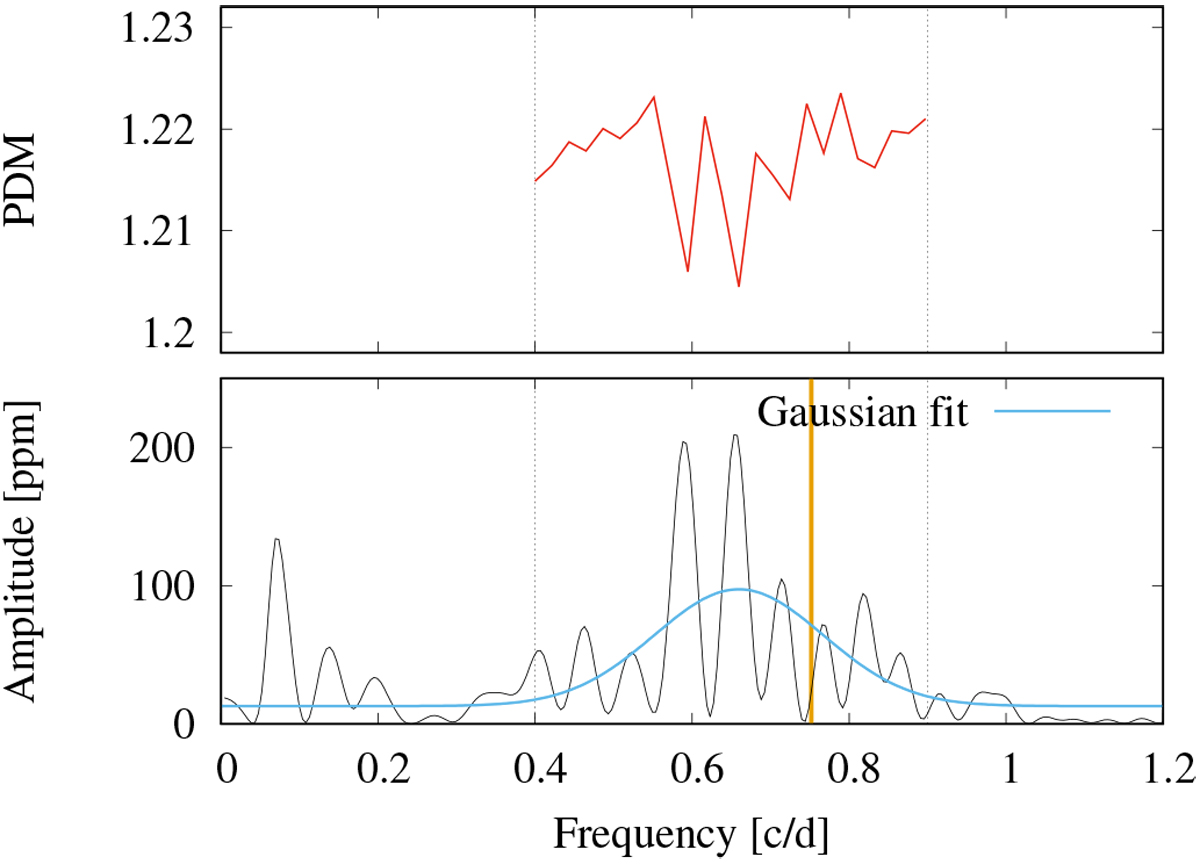
Periodicity of the residual light curve modulation. Top: phase dispersion minimization evaluated in the frequency range between 0.4 and 0.9 c/d. Bottom: Lomb-Scargle periodogram (amplitude in ppm versus frequency in cd−1) for the residuals of KELT-1, showing only the frequency range where most of the power lies. Overplotted in blue is the fit of a Gaussian function over the power to estimate an error for νmin. The vertical orange line indicates the measured projected rotation velocity of the star as determined by Siverd et al. (2012). For comparison, the frequency of the orbital motion of KELT-1b is 0.821 c/d.
Current usage metrics show cumulative count of Article Views (full-text article views including HTML views, PDF and ePub downloads, according to the available data) and Abstracts Views on Vision4Press platform.
Data correspond to usage on the plateform after 2015. The current usage metrics is available 48-96 hours after online publication and is updated daily on week days.
Initial download of the metrics may take a while.