Fig. A.1
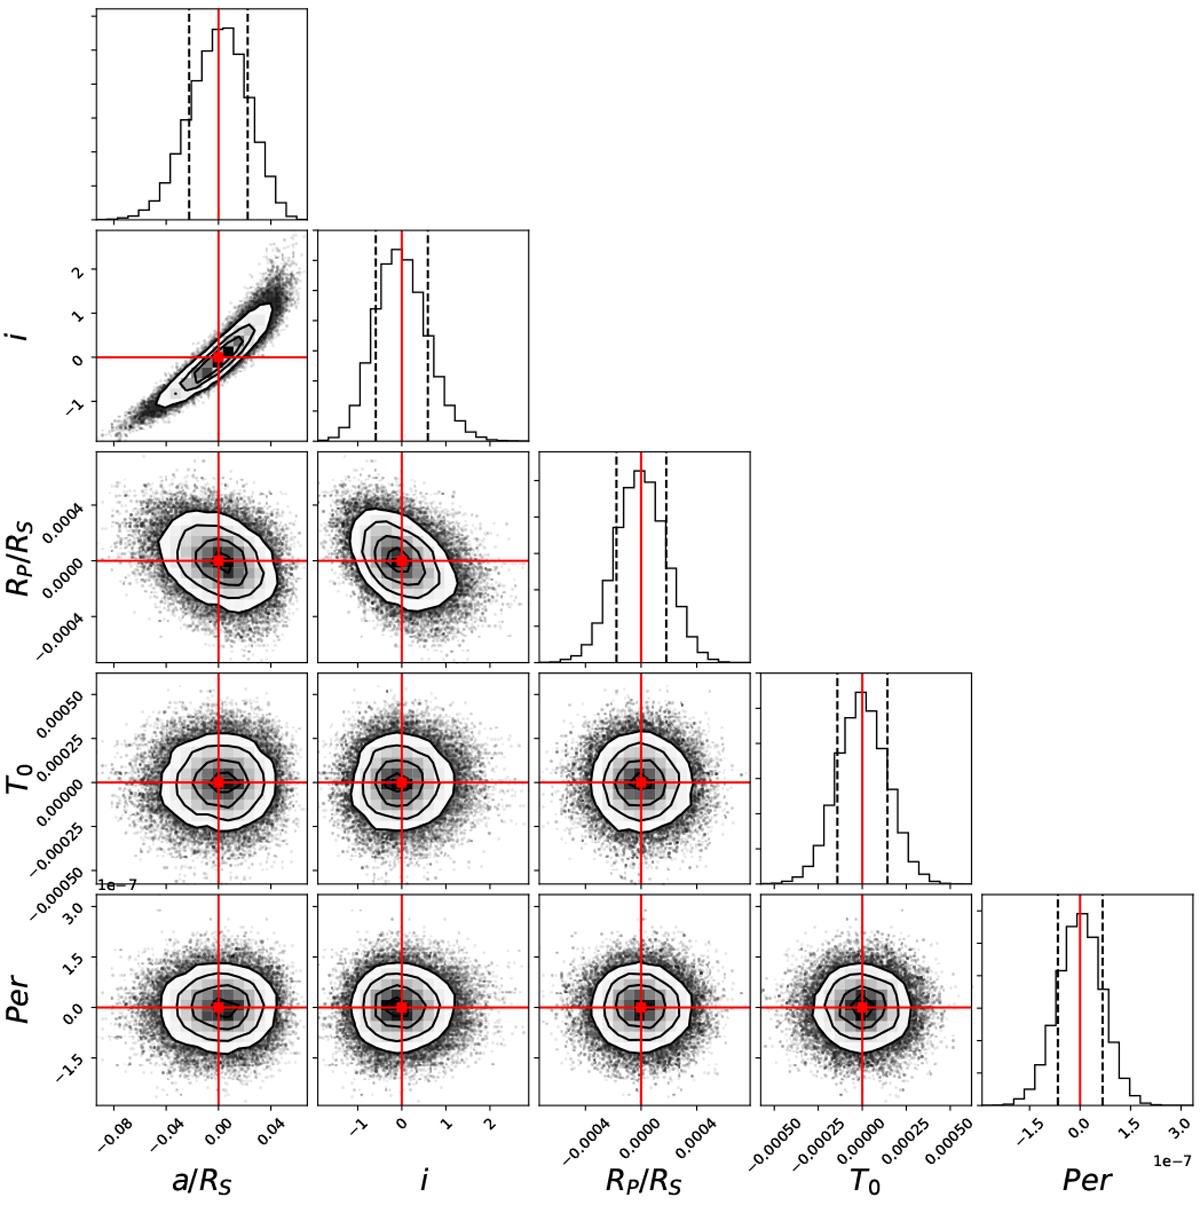
Posterior distributions for the primary transit parameters assuming a circular orbit for KELT-1b. In the figure, the red points indicate the best-fit values, and the colors of the contours highlight the 1, 2 and 3σ intervals. To allow for a better visual inspection of the uncertainties, the posteriors were shifted to the best-fit values specified in Table 1.
Current usage metrics show cumulative count of Article Views (full-text article views including HTML views, PDF and ePub downloads, according to the available data) and Abstracts Views on Vision4Press platform.
Data correspond to usage on the plateform after 2015. The current usage metrics is available 48-96 hours after online publication and is updated daily on week days.
Initial download of the metrics may take a while.