Free Access
Fig. 1
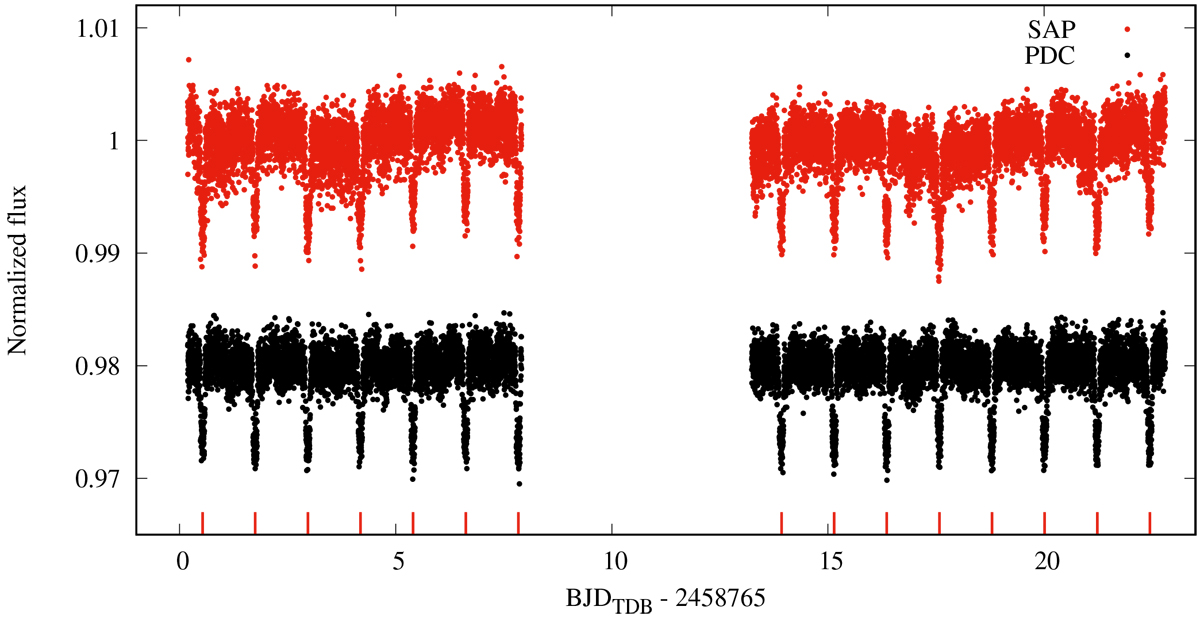
Detrended flux of KELT-1 observed by TESS. SAP photometry is indicated with red points and PDC with black circles. Both light curves are shown after our internal data preparation. The fifteen transits analyzed in this work are indicated in the bottom of the figure with red lines.
Current usage metrics show cumulative count of Article Views (full-text article views including HTML views, PDF and ePub downloads, according to the available data) and Abstracts Views on Vision4Press platform.
Data correspond to usage on the plateform after 2015. The current usage metrics is available 48-96 hours after online publication and is updated daily on week days.
Initial download of the metrics may take a while.