Fig. 2
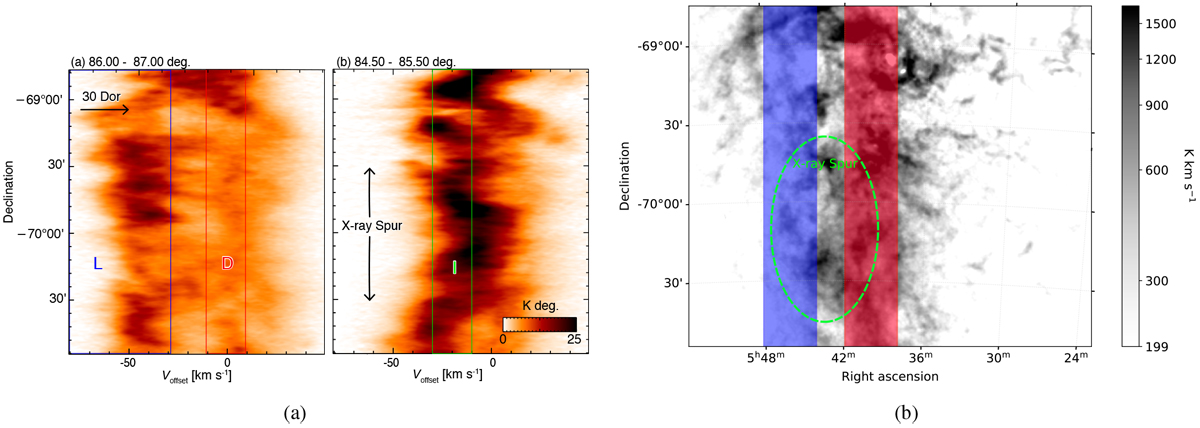
(a) Declination-Velocity diagram of two slices, integrated over the denoted Right ascension range. The approximate position of 30 Dor and the X-ray spur are shown with arrows. The colored boxes indicate the velocity ranges of the H I components. The integration slices are indicated in blue (left panel) and red (right panel) in (b), which also shows the H I I-component integrated in the − 30 to − 10 km s−1 range. The position of the X-ray spur is indicated with a green dashed ellipse.
Current usage metrics show cumulative count of Article Views (full-text article views including HTML views, PDF and ePub downloads, according to the available data) and Abstracts Views on Vision4Press platform.
Data correspond to usage on the plateform after 2015. The current usage metrics is available 48-96 hours after online publication and is updated daily on week days.
Initial download of the metrics may take a while.