Fig. 19
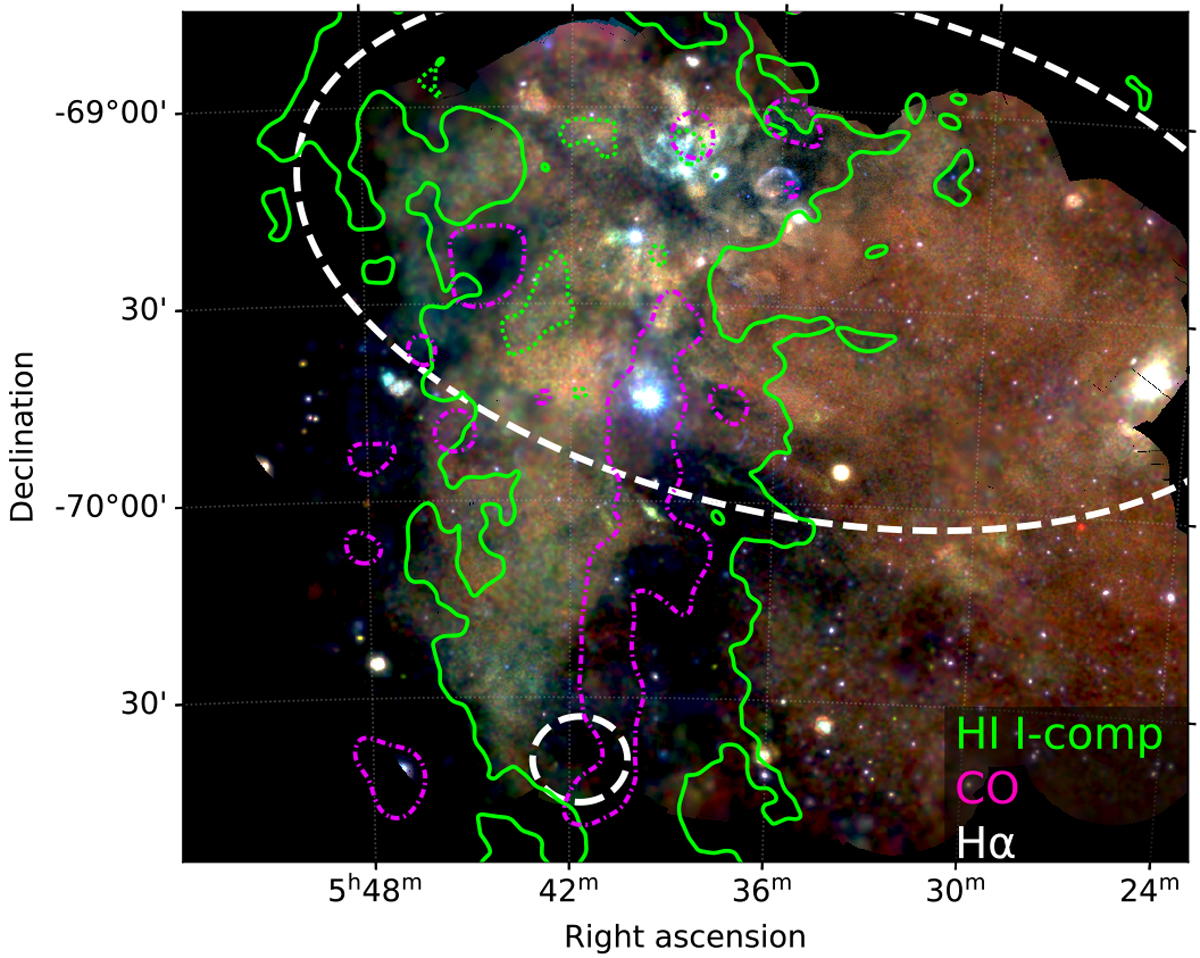
Multiwavelength composite of the X-ray mosaic with H I, CO and Hα data. The H I data are shown with contours in green (L-component) with the contour levels corresponding to the 90th percentile. Dashed contours indicate local minima. The magenta dash-dotted contours show the 95th percentile (> 1σ) of the CO data. The approximate area where significant Hα emission is observed is marked with white dashed regions.
Current usage metrics show cumulative count of Article Views (full-text article views including HTML views, PDF and ePub downloads, according to the available data) and Abstracts Views on Vision4Press platform.
Data correspond to usage on the plateform after 2015. The current usage metrics is available 48-96 hours after online publication and is updated daily on week days.
Initial download of the metrics may take a while.