Fig. 18
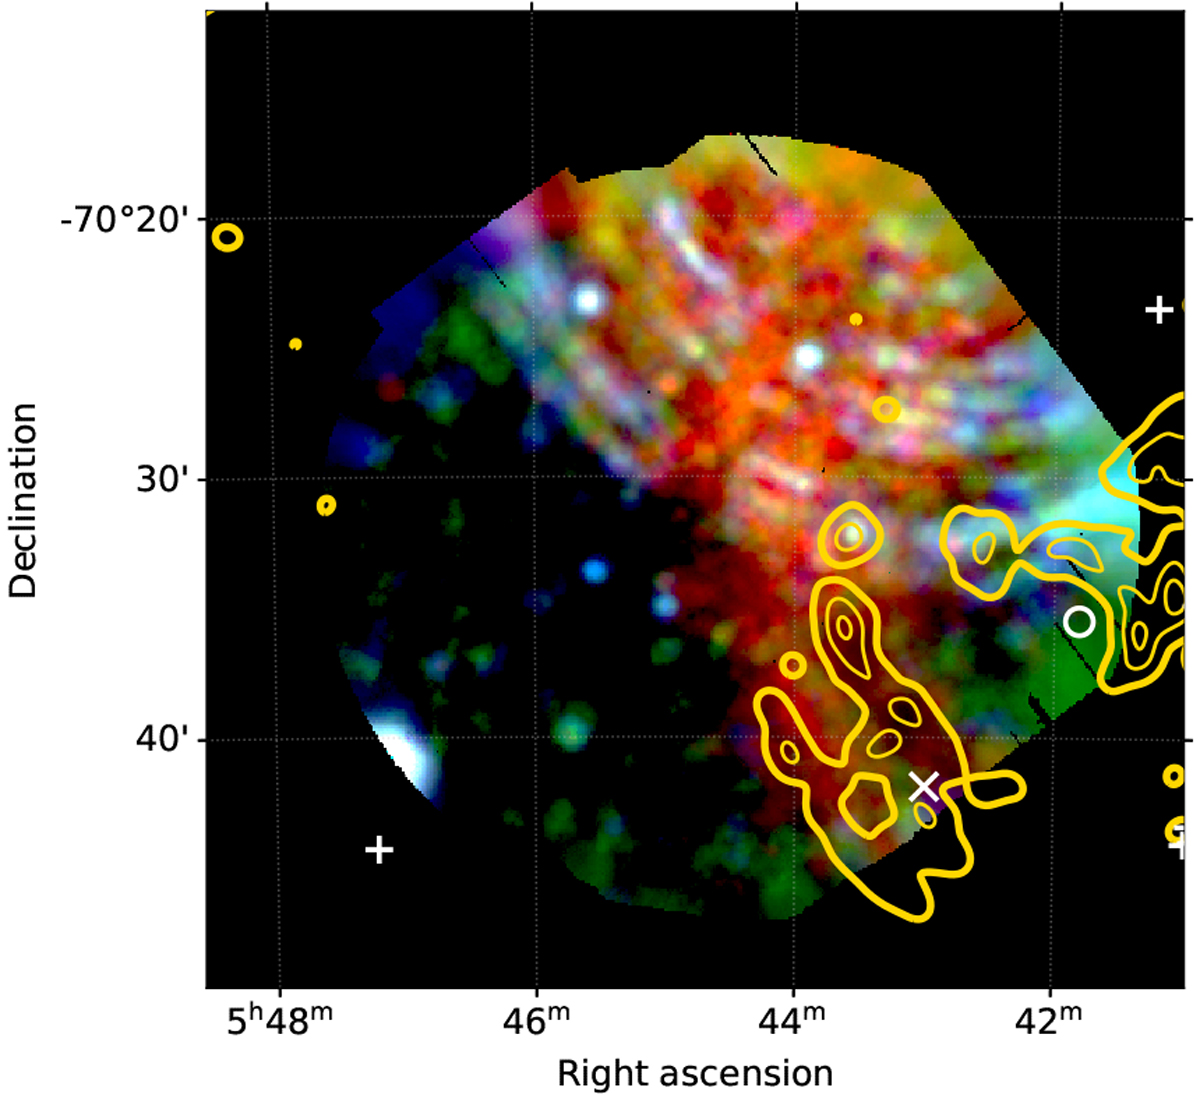
X-ray color composite with 0.4–1.25 keV (red), 1.25–2.00 keV (green) and 2.00–4.00 keV (blue) for the new observation of the spur (ObsID: 0820920101). The contours were calculated from the 85- 99 percentile range (0.68-7.04) of the [S II]/Hα ratio MCELS map (see Fig. 17b). The arc-shaped structures seen in the northern half in blue are caused by straylight from LMC X-1. Massive stars in the vicinity are marked by white Xs (O-stars), circles (WR-stars) and crosses (YSOs).
Current usage metrics show cumulative count of Article Views (full-text article views including HTML views, PDF and ePub downloads, according to the available data) and Abstracts Views on Vision4Press platform.
Data correspond to usage on the plateform after 2015. The current usage metrics is available 48-96 hours after online publication and is updated daily on week days.
Initial download of the metrics may take a while.