Fig. 16
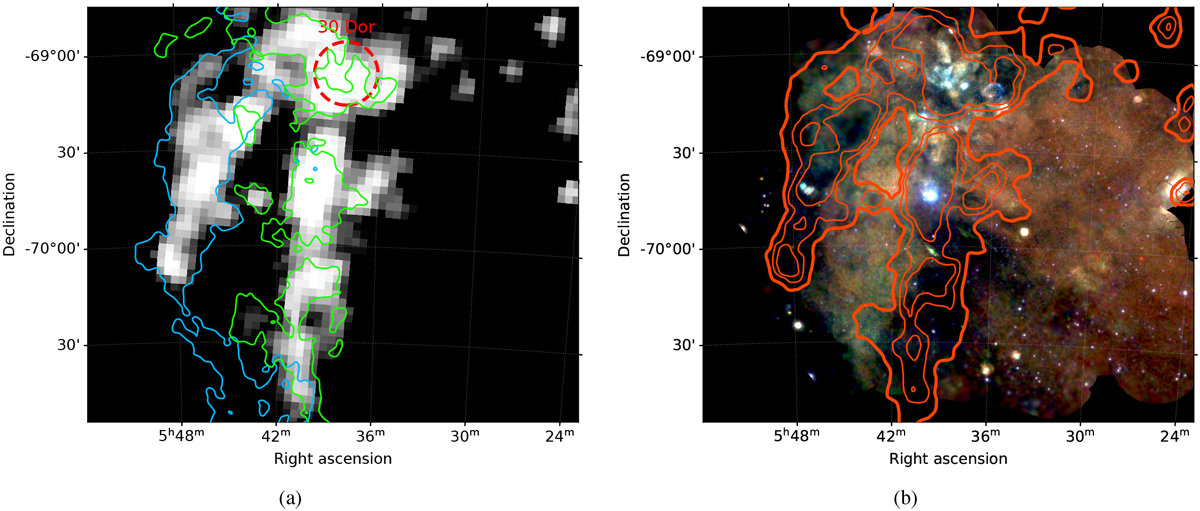
(a) Dust optical depth τ353 map from Planck data (Planck Collaboration XI 2014) in the range of τ353 = 2.0 × 10⁻⁵ to 6.4 × 10⁻⁵ (80- 98 percentile range). Overlayed are contours of the H I L-component (light blue) and I-component (green). The contour levels correspond to 870 and 930 K km s−1 for the L- and I-component, respectively. (b) Soft XMM-Newton three-color mosaic with 0.4–0.7 keV (red), 0.7–1.0 keV (green), 1.0–1.25 keV (blue) and τ353 dust optical depth contours (orange) calculated with the same scale as in (a).
Current usage metrics show cumulative count of Article Views (full-text article views including HTML views, PDF and ePub downloads, according to the available data) and Abstracts Views on Vision4Press platform.
Data correspond to usage on the plateform after 2015. The current usage metrics is available 48-96 hours after online publication and is updated daily on week days.
Initial download of the metrics may take a while.