Fig. 14
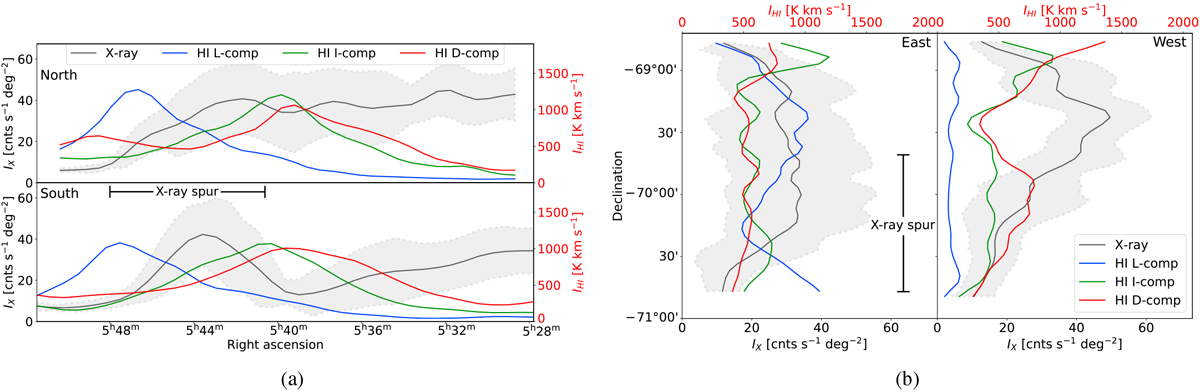
(a) Right ascension brightness profiles for X-rays IX (0.4–1.25 keV) and H I IHI. The integration range is Dec = −68°20′ to − 69°37′ (north, upper panel) and Dec = −69°37′ to − 70°54′ (south lower panel). (b) Declination brightness profiles for X-rays (0.4–1.25 keV) and H I. The integration range is RA = 5h 49m to 5h 40m (east, left panel) and RA = 5h40m to 5h 28m (west, right panel). The data were integrated in Dec (a) and RA (b) in slices of 200′′ width. The curves were smoothed with a 1D-gaussian (σ = 1) for visual purposes. The curve values were derived from the mean and the uncertainty band from the standard deviation of each slice. The extent of the X-ray spur is indicated with dashed lines.
Current usage metrics show cumulative count of Article Views (full-text article views including HTML views, PDF and ePub downloads, according to the available data) and Abstracts Views on Vision4Press platform.
Data correspond to usage on the plateform after 2015. The current usage metrics is available 48-96 hours after online publication and is updated daily on week days.
Initial download of the metrics may take a while.