Fig. 13
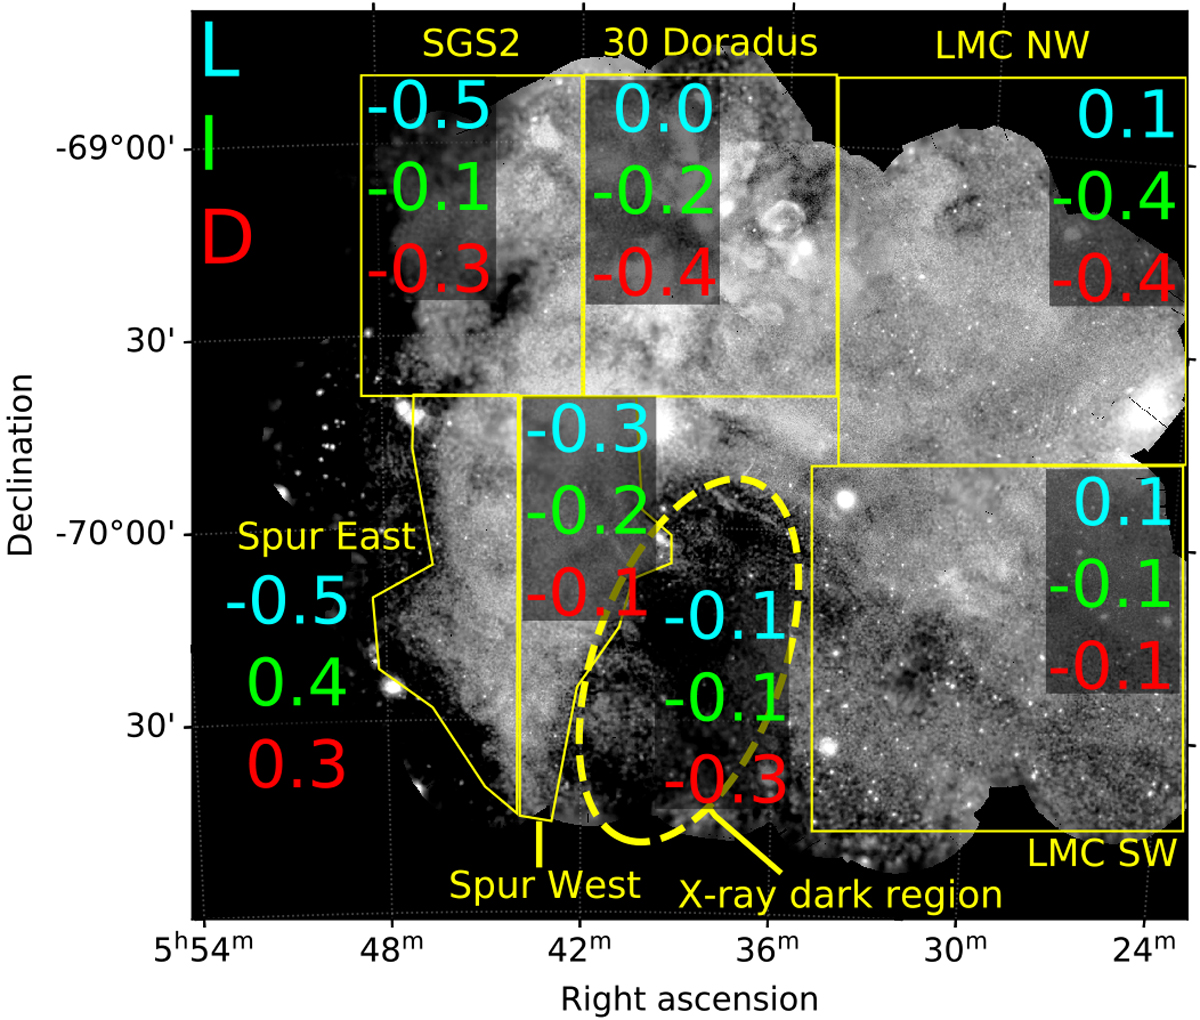
Soft X-ray mosaic (0.4-1.25 keV) with the individual regions (yellow) where we calculate the correlation coefficients of X-ray data with the H I data. The correlation coefficients for each region are shown in green for the L-component, cyan for the I-component and red for the D-component. Positive coefficients indicate correlation while negative coefficients indicate anticorrelation (linear relationship).
Current usage metrics show cumulative count of Article Views (full-text article views including HTML views, PDF and ePub downloads, according to the available data) and Abstracts Views on Vision4Press platform.
Data correspond to usage on the plateform after 2015. The current usage metrics is available 48-96 hours after online publication and is updated daily on week days.
Initial download of the metrics may take a while.