Fig. 6.
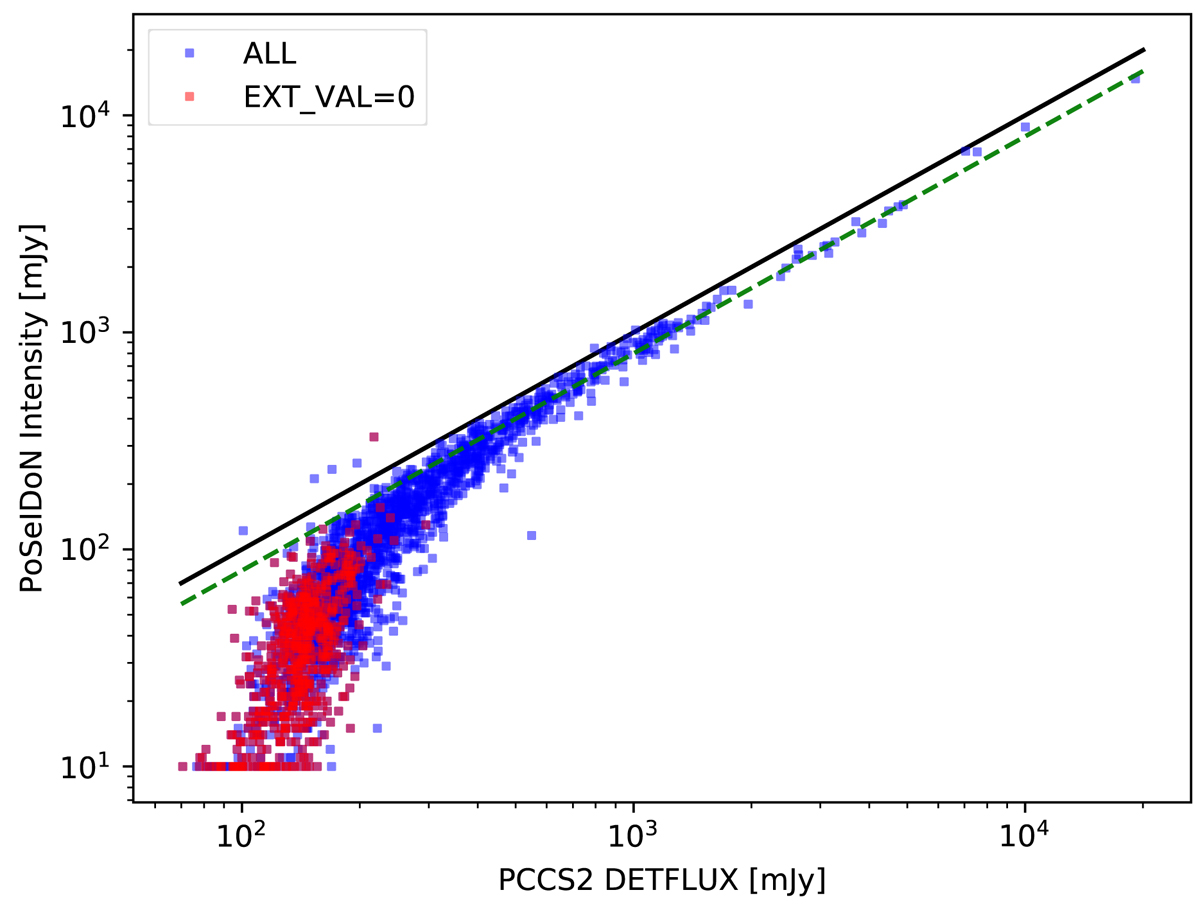
Comparison of the flux densities (DETFLUX) of the 2135 PCCS2 sources at 217 GHz and the intensities recovered by PoSeIDoN (blue circles). Those sources with the PCCS2 flag EXT_VAL = 0 are highlighted in red. The black solid line indicates the 1:1 relationship, while the green dashed line is the 10:8 (PCCS2 and PoSeIDoN, respectively).
Current usage metrics show cumulative count of Article Views (full-text article views including HTML views, PDF and ePub downloads, according to the available data) and Abstracts Views on Vision4Press platform.
Data correspond to usage on the plateform after 2015. The current usage metrics is available 48-96 hours after online publication and is updated daily on week days.
Initial download of the metrics may take a while.