Free Access
Fig. 5.
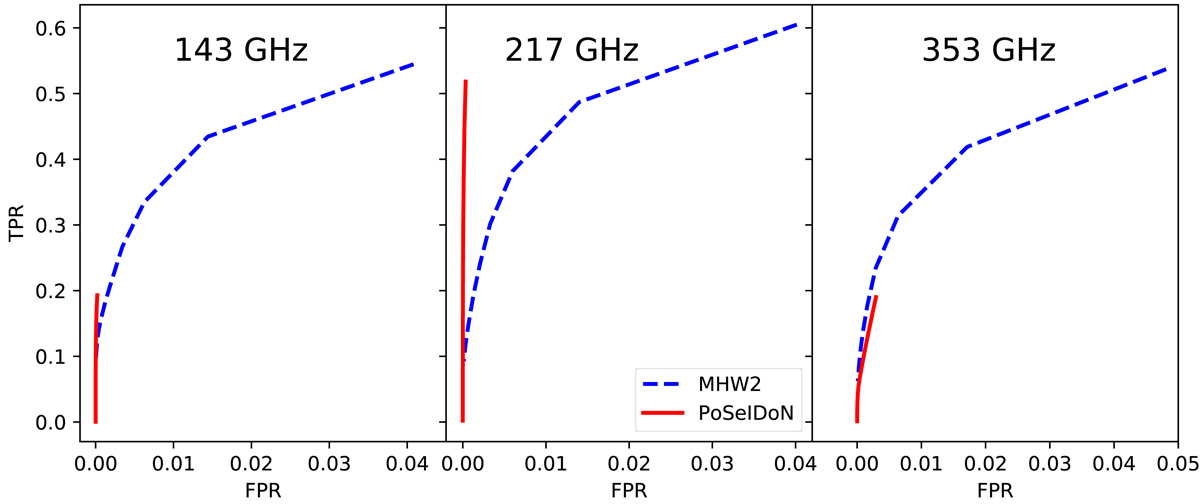
ROC plots for the studied methods at 143, 217, and 353 GHz (from left to right). In particular, PoSeIDoN is represented with the red solid line (using the flux density as a discriminating threshold), while the dashed blue line corresponds to the MHW2 starting at S/N = 1.5.
Current usage metrics show cumulative count of Article Views (full-text article views including HTML views, PDF and ePub downloads, according to the available data) and Abstracts Views on Vision4Press platform.
Data correspond to usage on the plateform after 2015. The current usage metrics is available 48-96 hours after online publication and is updated daily on week days.
Initial download of the metrics may take a while.