Free Access
Fig. 1.
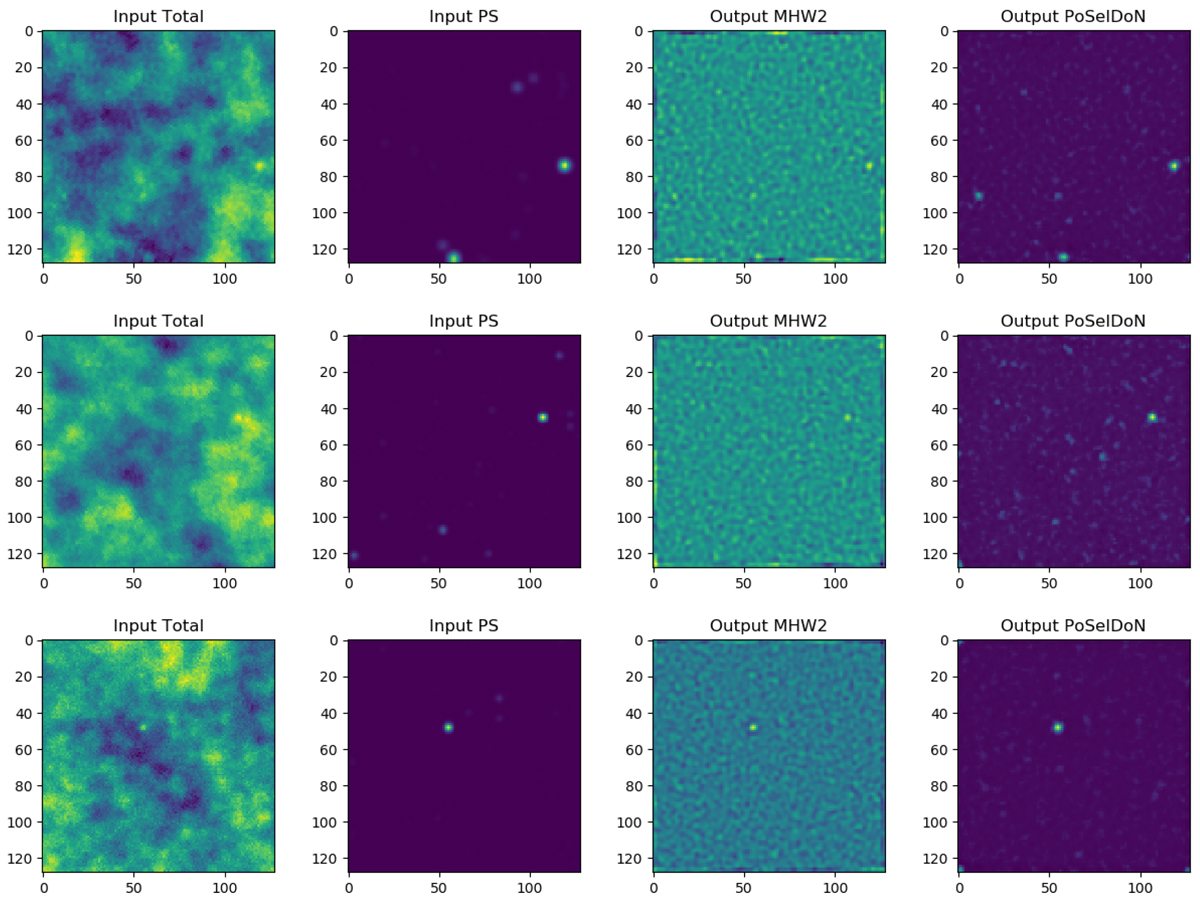
From left to right: sample patch comparison among the total and PS input validation maps and the MHW2 and PoSeIDoN PS outputs, for 143, 217, and 353 GHz (top, middle, and bottom panel, respectively) at b > 30° Galactic latitudes. The number, position, and flux density of the PSs are different at each frequency.
Current usage metrics show cumulative count of Article Views (full-text article views including HTML views, PDF and ePub downloads, according to the available data) and Abstracts Views on Vision4Press platform.
Data correspond to usage on the plateform after 2015. The current usage metrics is available 48-96 hours after online publication and is updated daily on week days.
Initial download of the metrics may take a while.