Fig. 8.
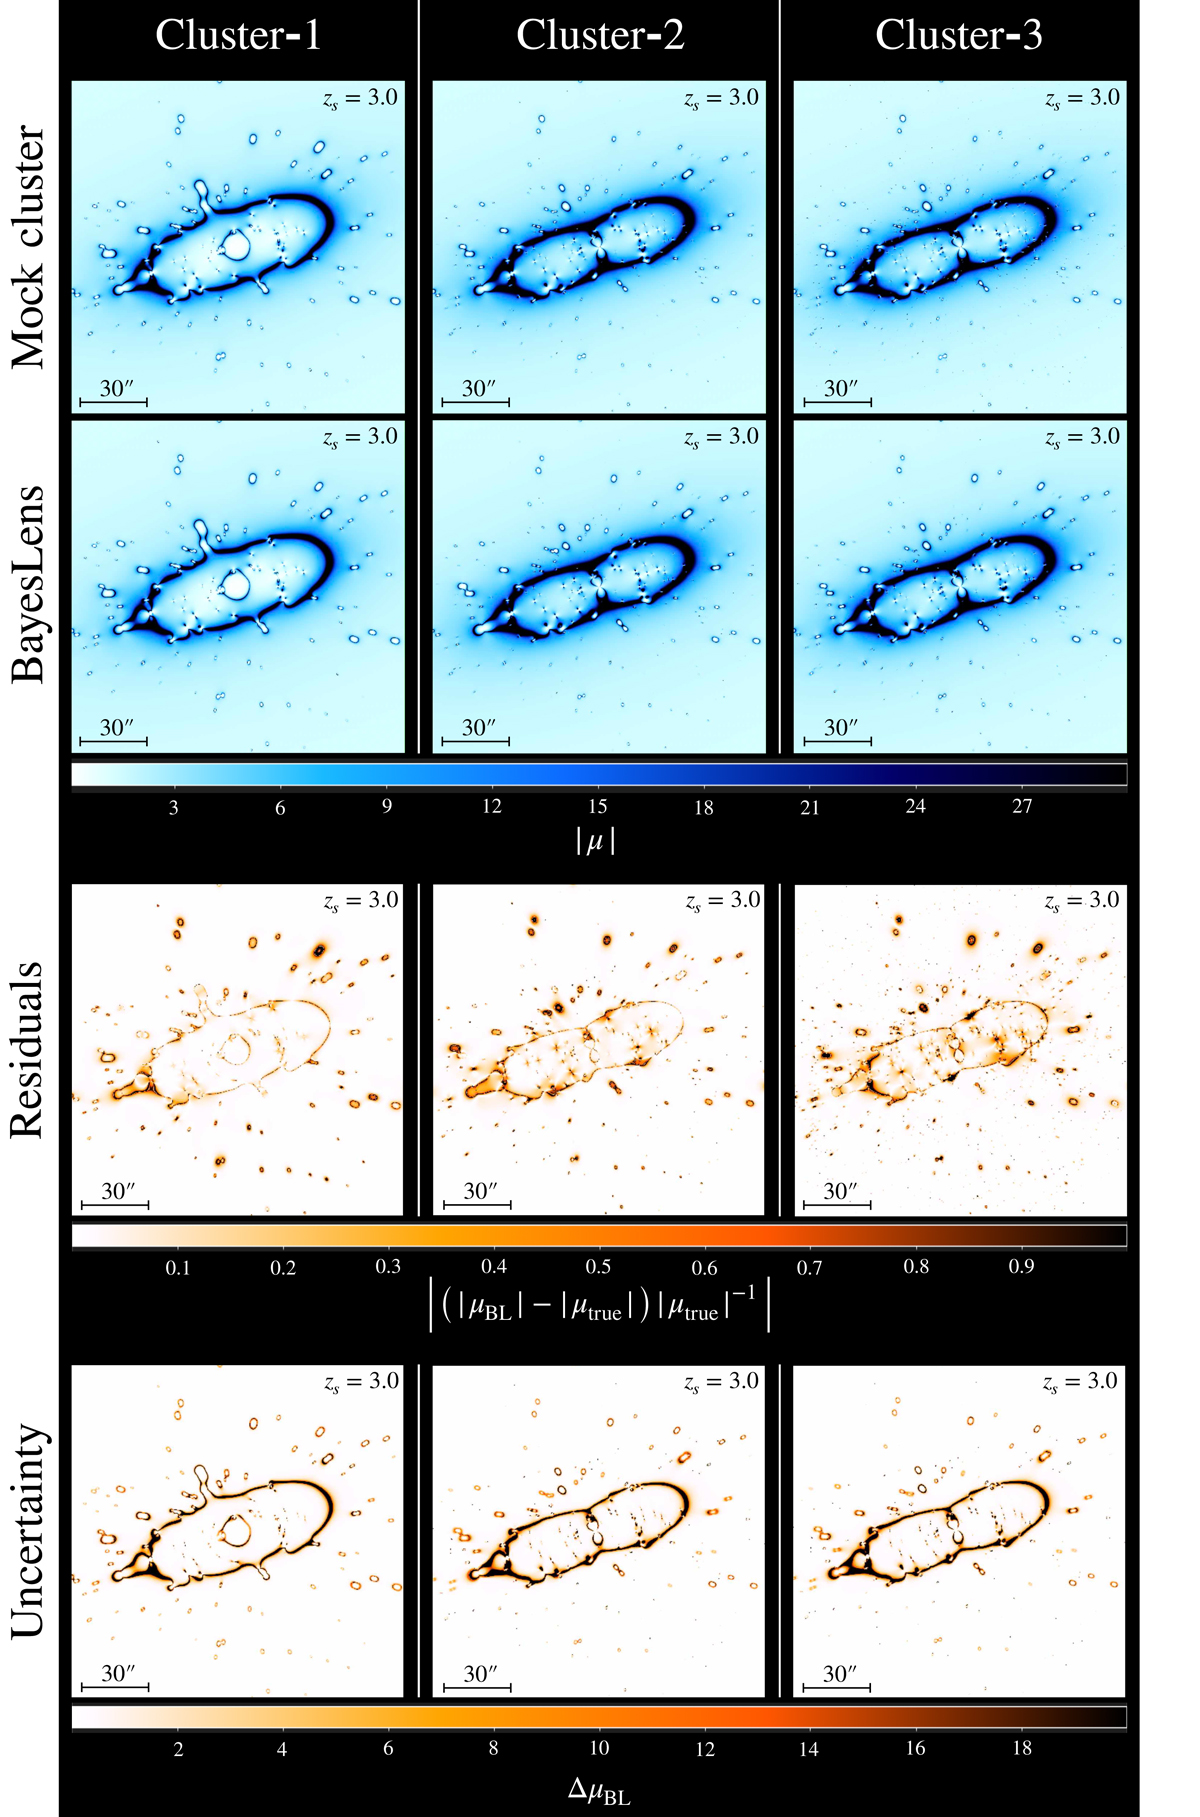
Maps of absolute magnification for the three simulated clusters computed for a source redshift zs = 3.0. In the first line, the magnification maps for the true Cluster-1, Cluster-2, and Cluster-3 mocks are plotted. The maps in the second line are obtained from BAYESLENS best-fit lens models of the clusters, while in the third line the normalized residuals between BAYESLENS and true magnifications, ||μBL|−|μtrue|/|μtrue||, are shown. In the last line, the absolute uncertainties associated with BAYESLENS magnification maps are plotted. These are computed considering 100 realizations of the lens models by randomly extracting 100 parameter samples from the MCMC chains and taking half of the difference between the 84th and 16th percentiles of magnification distributions in each pixel.
Current usage metrics show cumulative count of Article Views (full-text article views including HTML views, PDF and ePub downloads, according to the available data) and Abstracts Views on Vision4Press platform.
Data correspond to usage on the plateform after 2015. The current usage metrics is available 48-96 hours after online publication and is updated daily on week days.
Initial download of the metrics may take a while.