Fig. 6.
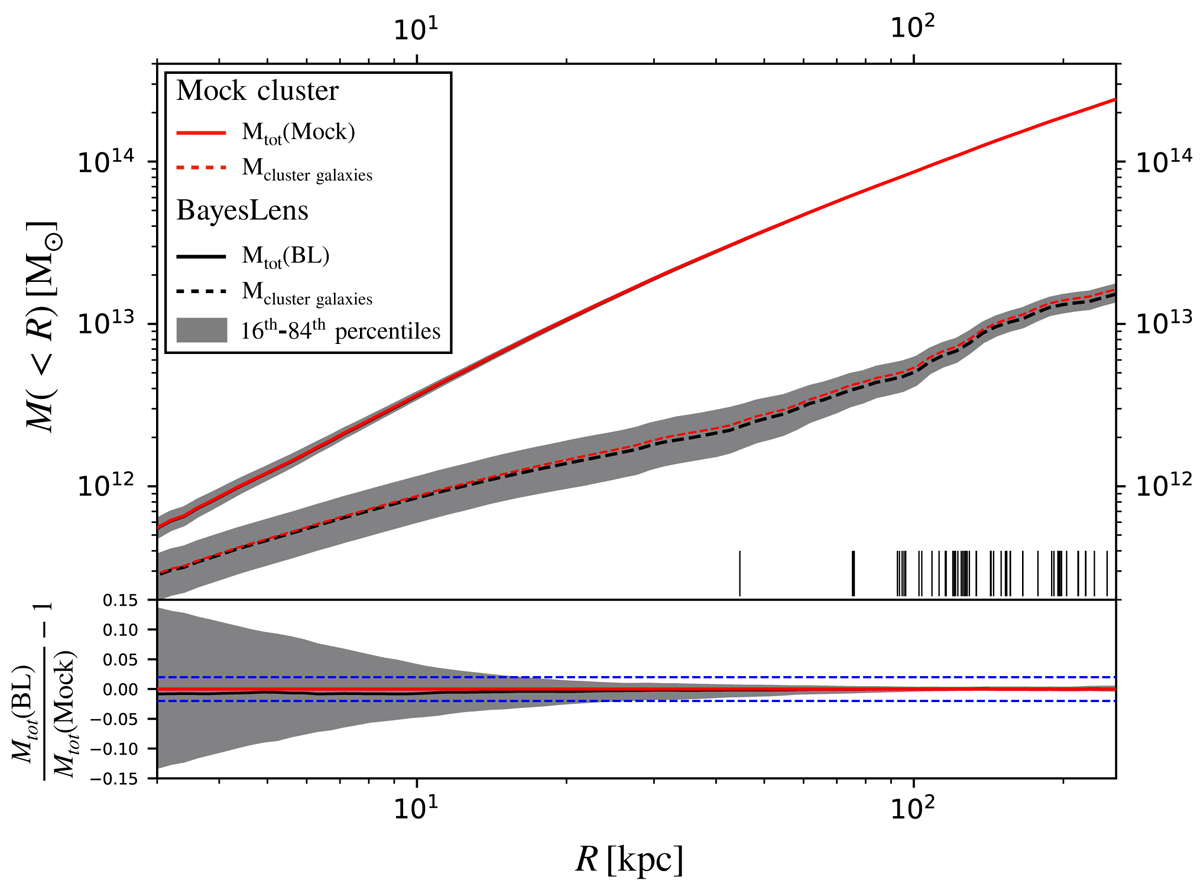
Top: cumulative projected total mass profiles for the Custer-1 mock as a function of the projected distance from the BCG. The red line corresponds to the true mass profile. The solid black line is obtained from the best-fit BAYESLENS model. The projected distances of the multiple images from the BCG center are shown as vertical black lines. Bottom: relative variation of the BAYESLENS total mass profile with respect to the true mass profile of the mock cluster. The dashed blue line in the bottom panel indicates a 2% relative difference between the mock and model mass profiles. In both panels, the gray shaded stripes delimit the 16th–84th percentiles of the mass profiles with parameters drawn from the posterior.
Current usage metrics show cumulative count of Article Views (full-text article views including HTML views, PDF and ePub downloads, according to the available data) and Abstracts Views on Vision4Press platform.
Data correspond to usage on the plateform after 2015. The current usage metrics is available 48-96 hours after online publication and is updated daily on week days.
Initial download of the metrics may take a while.