Fig. 4.
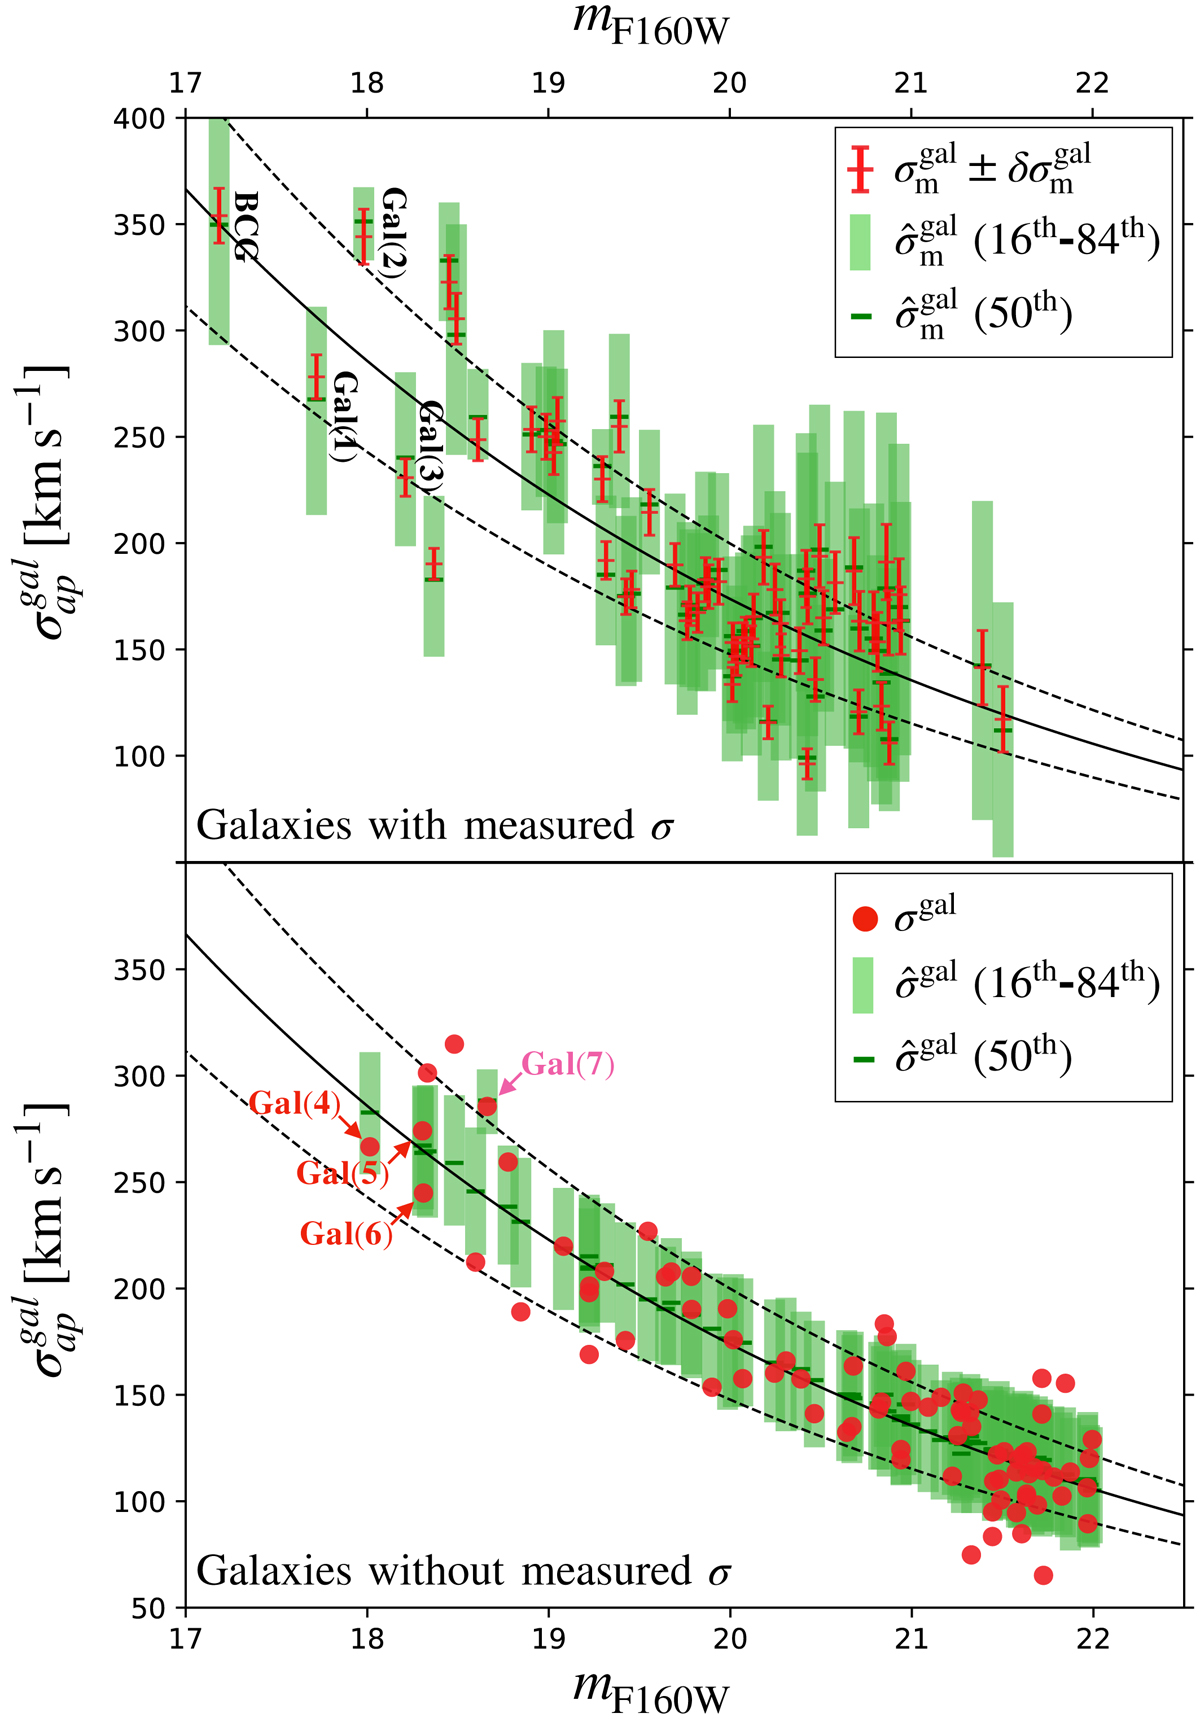
Velocity dispersions of the Cluster-1 member galaxies as a function of their magnitudes. In the mock cluster, a 15% of Gaussian scatter (black dashed lines) is assumed for the galaxy velocity dispersion around the scaling relation plotted as a solid black line. Top panel: measured velocity dispersions with their errors are plotted in red. Similarly, the true velocity dispersions of the galaxies without a measured velocity dispersion are denoted with red dots in the bottom panel. The green rectangles in the plots are bounded by the 16th and 84th percentiles of the marginalized posterior distribution for each galaxy, while the 50th percentiles are the small green bars. The most luminous galaxies with and without measured velocity dispersion are labeled in black and red, respectively. The cluster member Gal(7) forming the galaxy-scale strong lensing system shown in the cut-out of Fig. 1 is labeled in magenta.
Current usage metrics show cumulative count of Article Views (full-text article views including HTML views, PDF and ePub downloads, according to the available data) and Abstracts Views on Vision4Press platform.
Data correspond to usage on the plateform after 2015. The current usage metrics is available 48-96 hours after online publication and is updated daily on week days.
Initial download of the metrics may take a while.