Fig. 3.
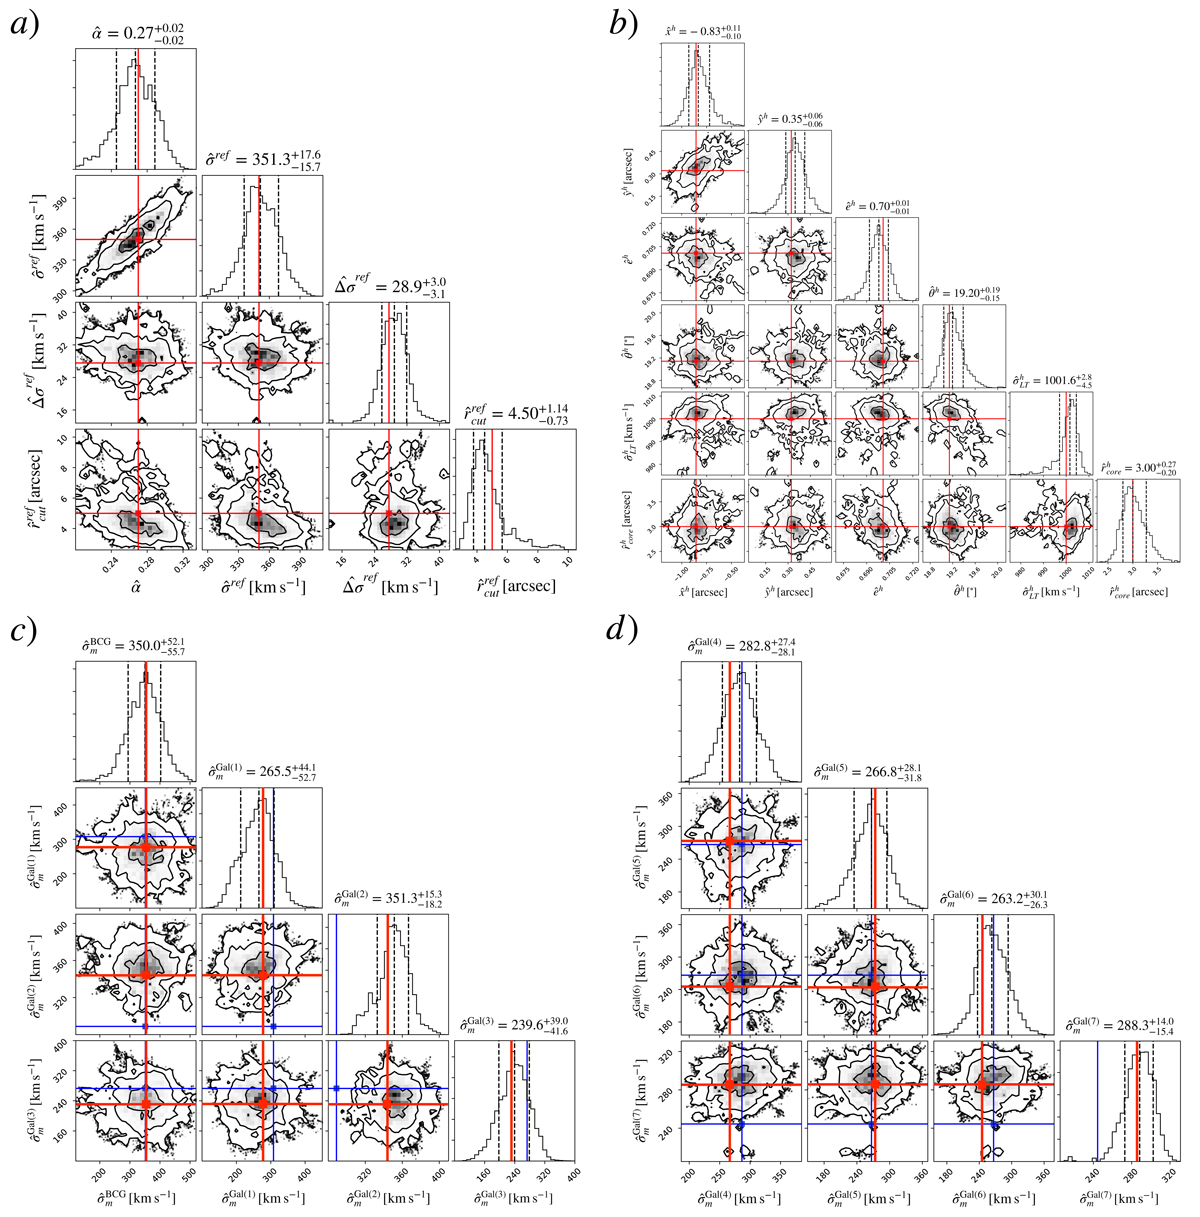
BAYESLENS marginalized posterior distributions on the free parameters of the Cluster-1 mocks. The contours limit the 1σ, 2σ, and 3σ regions. The black dashed vertical lines in the histograms correspond to the 16th, 50th, and 84th percentiles of the marginalized distributions (these values are reported in the titles). The solid red lines are the true values of the parameters of the mock cluster. Panel a: scaling relation hyperparameters. In this plot, ![]() is omitted because its value is not optimized in BAYESLENS, but is directly derived from Eq. (5) assuming γ = 2. Panel b: posterior distributions for the cluster-scale halo parameters, while panel c: average velocity dispersions within apertures of radius R = 0.8″ of the four brightest measured galaxies (BCG, Gal(1), Gal(2), and Gal(3)). Panel d: average velocity dispersions within apertures of radius R = 0.8″ of the three brightest galaxies without a measured σ: Gal(4), Gal(5), and Gal(6). In the plot, the galaxy Gal(7) forming a galaxy-scale strong lensing system (see text) is included. Panels c and d: blue vertical lines indicate the stellar, aperture-averaged, velocity dispersion of cluster members predicted by the best-fit σgal − mF160W scaling relation (zero-scatter solution).
is omitted because its value is not optimized in BAYESLENS, but is directly derived from Eq. (5) assuming γ = 2. Panel b: posterior distributions for the cluster-scale halo parameters, while panel c: average velocity dispersions within apertures of radius R = 0.8″ of the four brightest measured galaxies (BCG, Gal(1), Gal(2), and Gal(3)). Panel d: average velocity dispersions within apertures of radius R = 0.8″ of the three brightest galaxies without a measured σ: Gal(4), Gal(5), and Gal(6). In the plot, the galaxy Gal(7) forming a galaxy-scale strong lensing system (see text) is included. Panels c and d: blue vertical lines indicate the stellar, aperture-averaged, velocity dispersion of cluster members predicted by the best-fit σgal − mF160W scaling relation (zero-scatter solution).
Current usage metrics show cumulative count of Article Views (full-text article views including HTML views, PDF and ePub downloads, according to the available data) and Abstracts Views on Vision4Press platform.
Data correspond to usage on the plateform after 2015. The current usage metrics is available 48-96 hours after online publication and is updated daily on week days.
Initial download of the metrics may take a while.