Fig. 2.
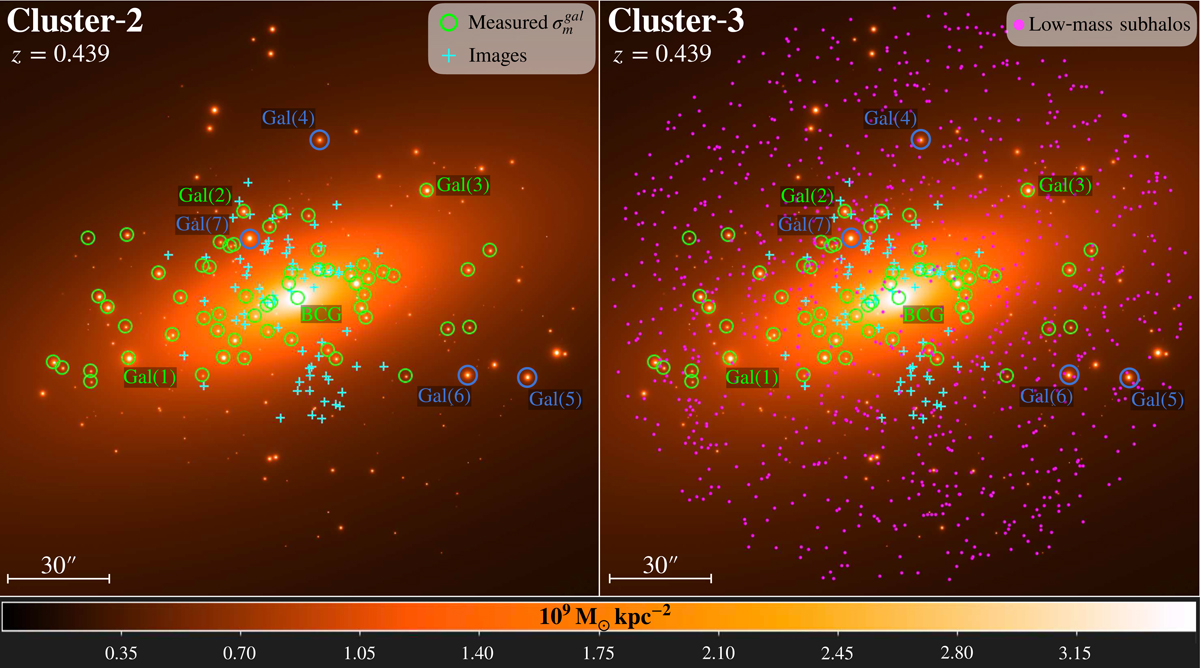
Mass density distribution, color coded in M⊙ kpc−2, of the central region of the Cluster-2, and Cluster-3 mocks. As in Fig. 1, green circles denote the galaxies for which we have a measured velocity dispersion, while cyan crosses are the observed multiple images. The same set of measured and unmeasured galaxies selected in Fig. 1 are labeled in green and blue, respectively. Right panel: magenta data points are plotted showing the spatial distribution of the low-mass subhalo population of Cluster-3.
Current usage metrics show cumulative count of Article Views (full-text article views including HTML views, PDF and ePub downloads, according to the available data) and Abstracts Views on Vision4Press platform.
Data correspond to usage on the plateform after 2015. The current usage metrics is available 48-96 hours after online publication and is updated daily on week days.
Initial download of the metrics may take a while.