Fig. 1.
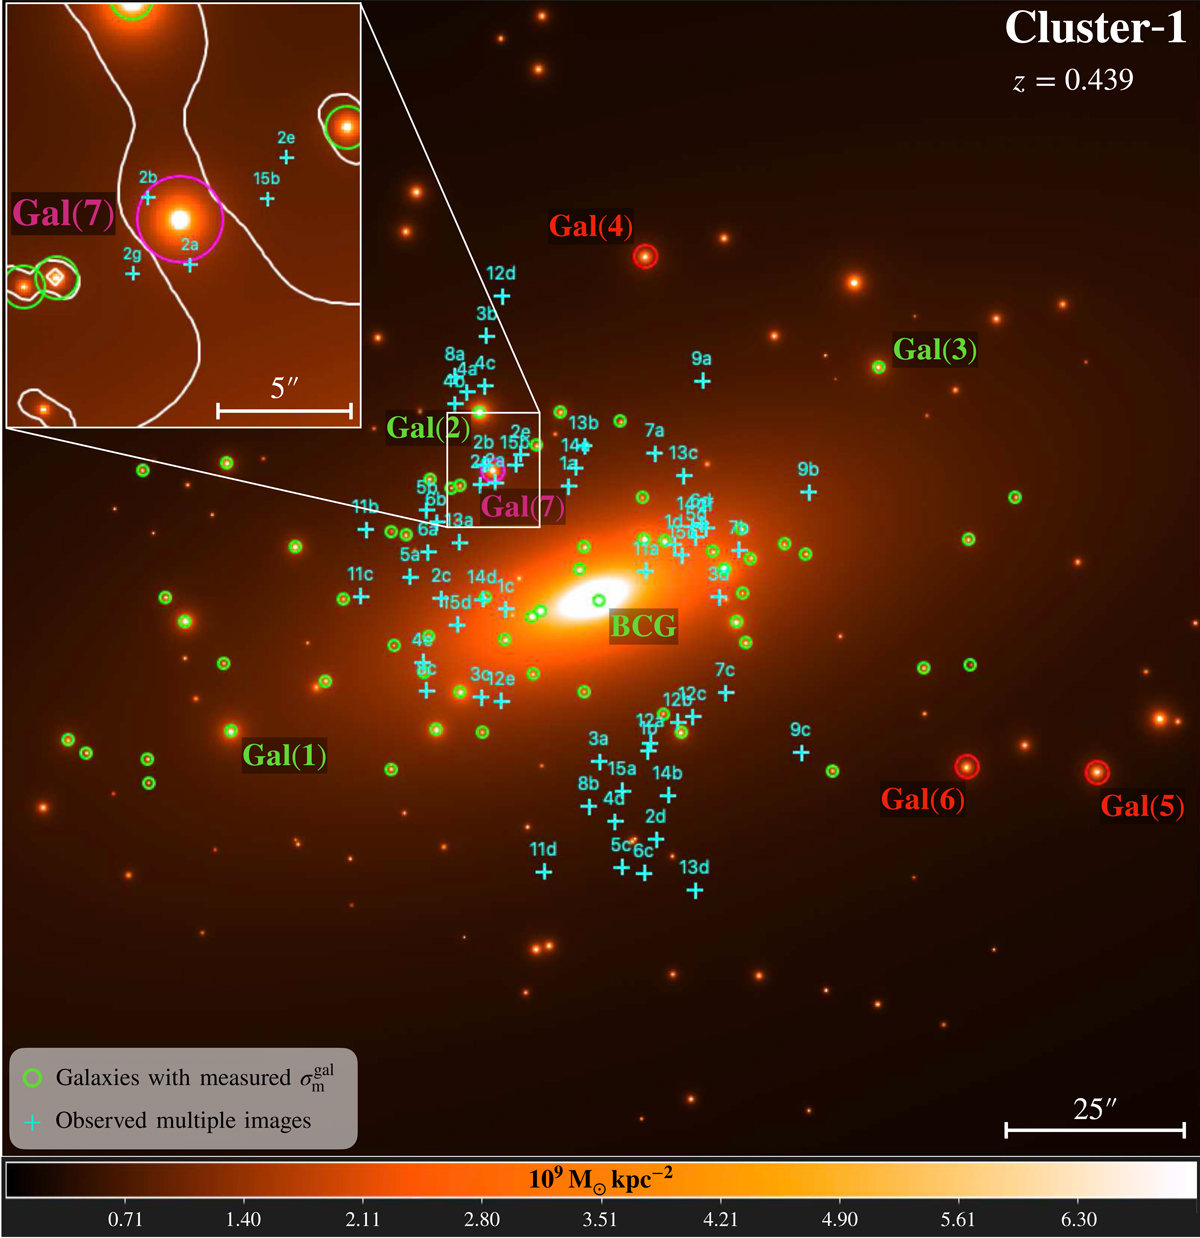
Mass density distribution, color coded in M⊙ kpc−2, of the central region of the Cluster-1 mock used for our functional tests, loosely based on the Caminha et al. (2017b) lens model for the cluster MACS J1206.2−0847 at redshift z = 0.439. Green circles denote the cluster galaxies with measured velocity dispersion within apertures of radius R = 0.8″. The brightest galaxies with and without measured velocity dispersion are labeled in green and red, respectively. Cyan crosses denote the position of observed multiple images. In the inset, a galaxy-scale multiple-image system is shown around the cluster member Gal(7) (labeled in magenta). The critical lines computed for the redshift, z2 = 2.539, of the second family of multiple images are shown in white.
Current usage metrics show cumulative count of Article Views (full-text article views including HTML views, PDF and ePub downloads, according to the available data) and Abstracts Views on Vision4Press platform.
Data correspond to usage on the plateform after 2015. The current usage metrics is available 48-96 hours after online publication and is updated daily on week days.
Initial download of the metrics may take a while.