Fig. B.1.
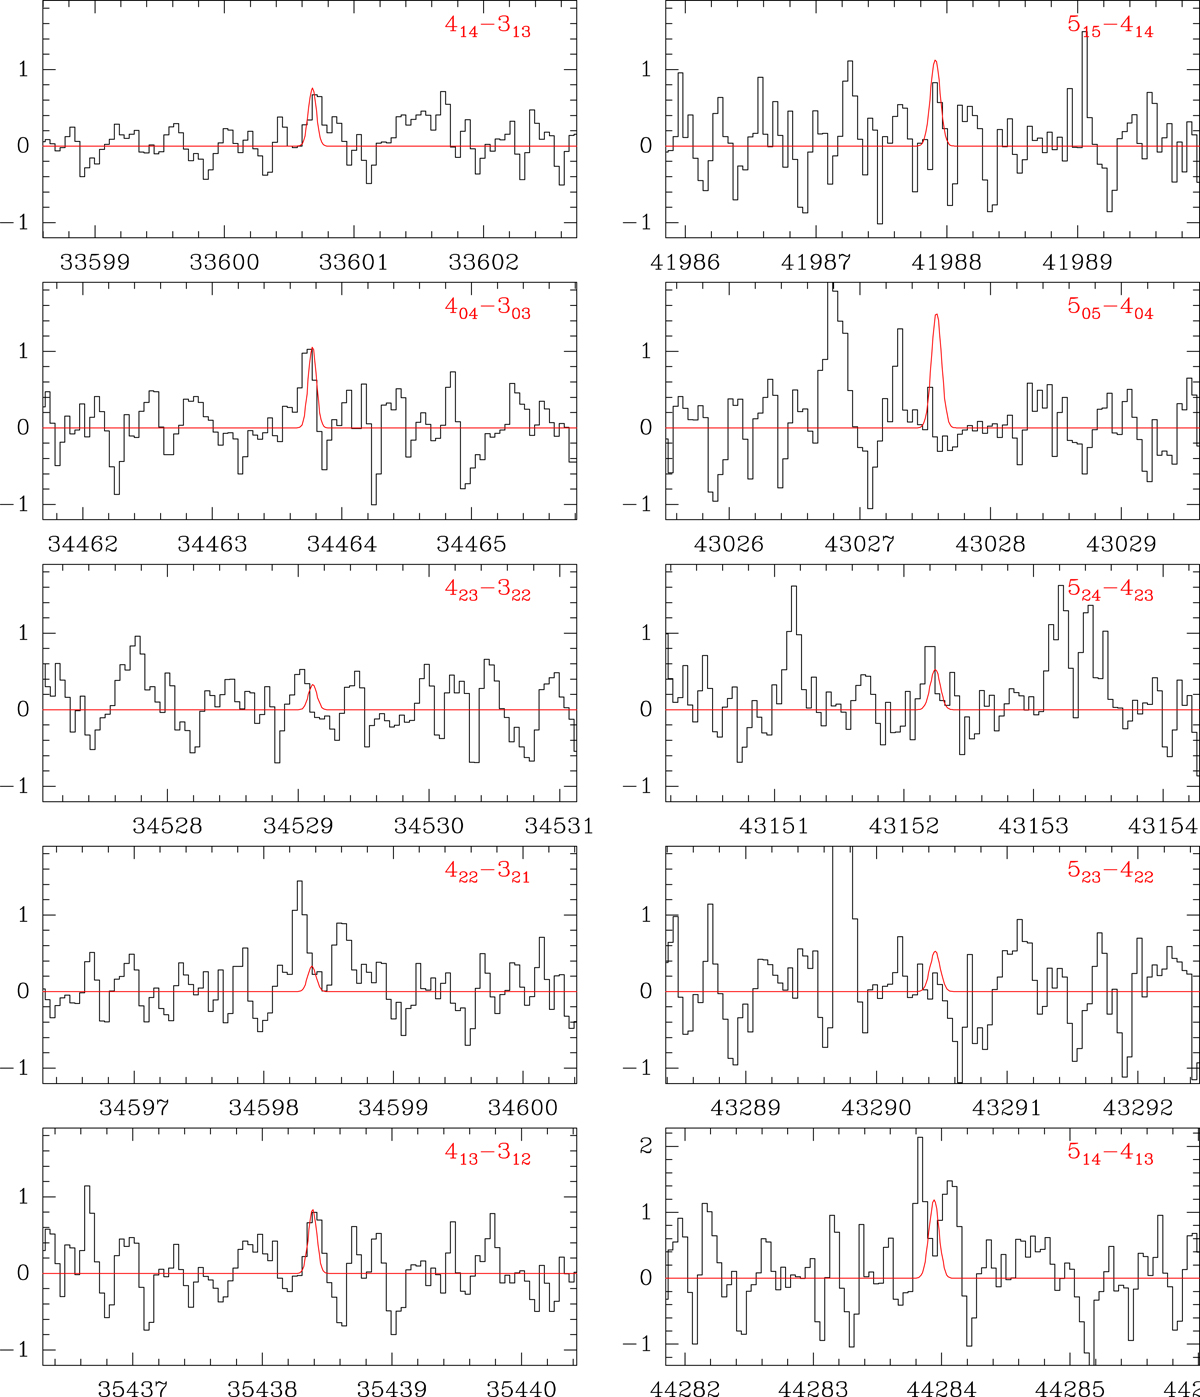
Observed lines of CH3CH2CCH in the Q-band toward TMC-1. The abscissa corresponds to the rest frequency assuming a local standard of rest velocity of 5.83 km s−1. The ordinate is the antenna temperature, corrected for atmospheric and telescope losses, in mK. The red line shows the synthetic spectrum obtained using the parameters derived from a rotational diagram of the observed lines (Tr = 5 K and N(CH3CH2CCH) = 9.0 × 1011 cm−2). The rotational quantum numbers are provided in the upper right corners of each panel.
Current usage metrics show cumulative count of Article Views (full-text article views including HTML views, PDF and ePub downloads, according to the available data) and Abstracts Views on Vision4Press platform.
Data correspond to usage on the plateform after 2015. The current usage metrics is available 48-96 hours after online publication and is updated daily on week days.
Initial download of the metrics may take a while.