Fig. 2.
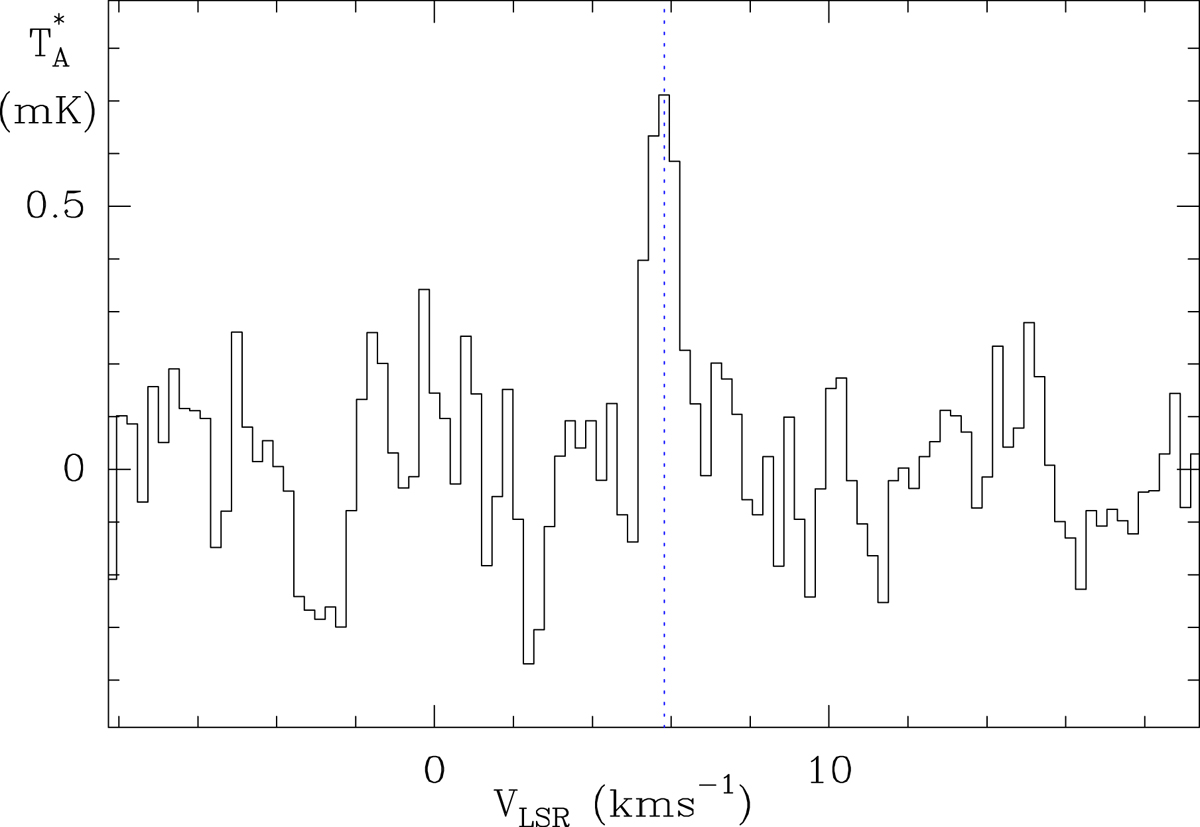
Line profile for CH3CH2CCH toward TMC-1 from stacking the signal from the transitions of this species in the 31−50 GHz frequency range. The abscissa corresponds to the local standard of rest velocity. The ordinate is the antenna temperature, corrected for atmospheric and telescope losses, in mK. The observed spectra from the individual lines are shown in Fig. B.1.
Current usage metrics show cumulative count of Article Views (full-text article views including HTML views, PDF and ePub downloads, according to the available data) and Abstracts Views on Vision4Press platform.
Data correspond to usage on the plateform after 2015. The current usage metrics is available 48-96 hours after online publication and is updated daily on week days.
Initial download of the metrics may take a while.