Fig. 7.
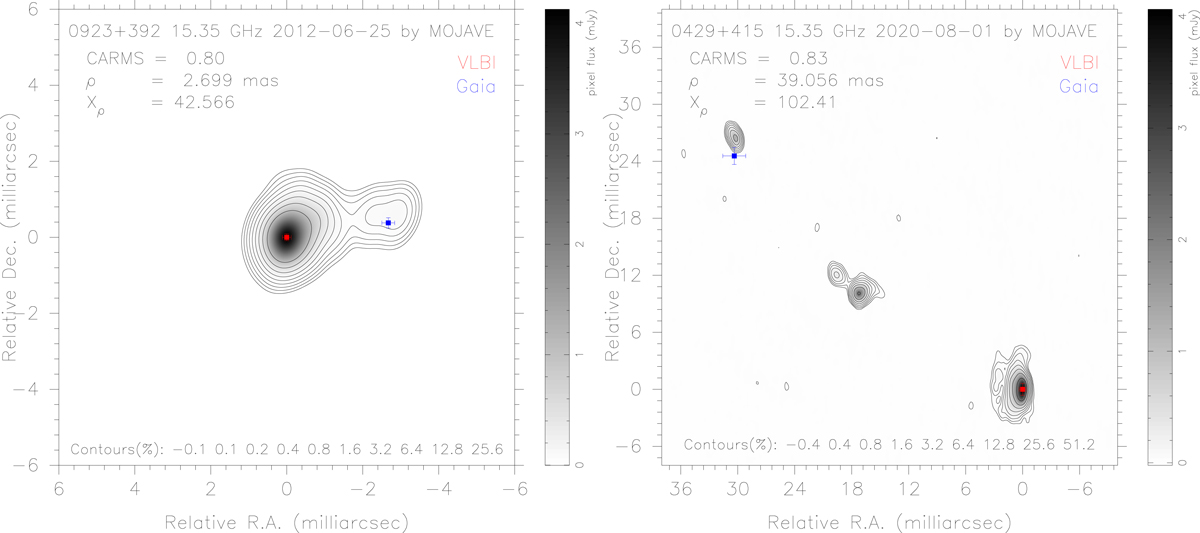
Explanation of the large Gaia-VLBI position differences for two sources, 0923+392 with ρ = 2.7 mas (4C39.25, CARMS = 0.80, left) and 0429+415 with ρ = 39.1 mas (CARMS = 0.83, right), based on the MOJAVE images (see the caption of Fig. 4 for the plot design). According to the spectral index images from the MOJAVE project, the cores are not the brightest components in the images. The core of the source 0923+392 is the weak western component, and the core of the source 0429+415 is the northeastern component. Their Gaia positions are located close to the cores, given that the VLBI positions are located at the peaks of flux. These two sources strongly demonstrate the effects of source structure on the position differences between VLBI and Gaia; the source positions from geodetic VLBI are dominated by the positions of the peak fluxes, whereas the optical positions from Gaia are located close to the cores.
Current usage metrics show cumulative count of Article Views (full-text article views including HTML views, PDF and ePub downloads, according to the available data) and Abstracts Views on Vision4Press platform.
Data correspond to usage on the plateform after 2015. The current usage metrics is available 48-96 hours after online publication and is updated daily on week days.
Initial download of the metrics may take a while.