Fig. 4.
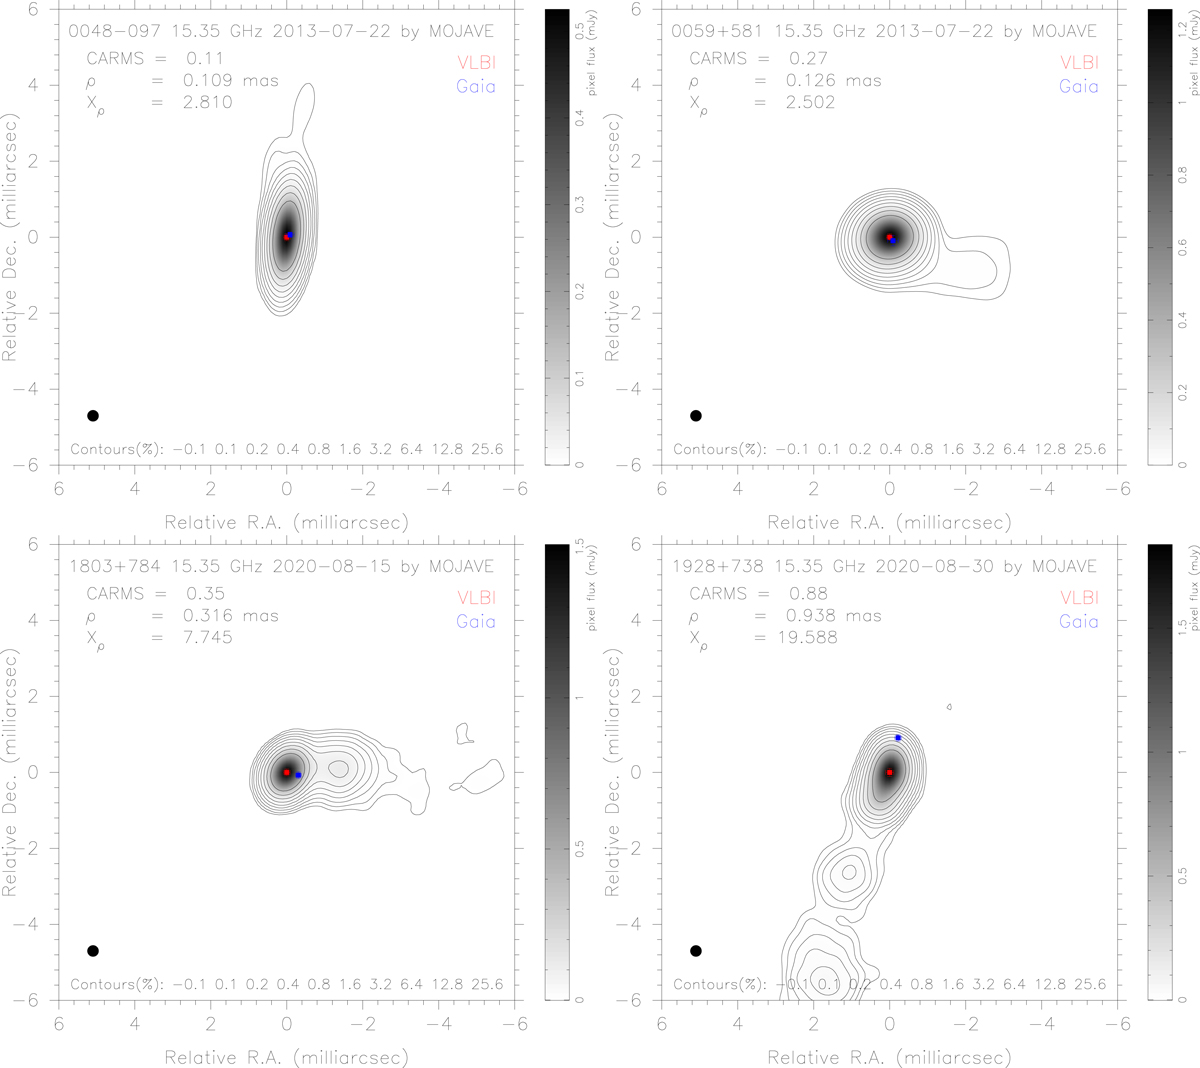
MOJAVE images of four sources, 0048−097 (CARMS = 0.11, upper left), 0059+581 (CARMS = 0.27, upper right), 1803+784 (CARMS = 0.35, bottom left), and 1928+738 (CARMS = 0.88, bottom right). These images were made based on VLBA observations at 15.35 GHz by the MOJAVE project. The peaks of flux are selected as the origins. The VLBI positions are formally assumed to be at the origins, as shown by the red dots. Since the MOJAVE images and the ICRF3 are derived from observations at different frequencies, this assumption may introduce systematic errors. Based on their position differences between the Gaia EDR3 and the ICRF3, the Gaia positions are thus located at the blue dots. The error bars are the 3σ uncertainties of right ascension and declination from Gaia and VLBI. It is also conspicuous that when Xρ > 4 the VLBI to Gaia position vectors favor the directions along and opposite to the jets, as shown by Kovalev et al. (2017), Petrov et al. (2019). The ρ and Xρ values are shown in the upper left corner of each plot. These four plots demonstrate how the scales of the structure appear in terms of different CARMS values. Nevertheless, we should mention that the CARMS values and the ICRF3 are based on VLBI observations at the frequency band around 8.4 GHz over 40 years, while these images were made from observations at 15.35 GHz during the short periods shown at the top of each plot. The jet components always become more prominent at the lower frequency bands. The images were convolved with a circular beam of 0.3 mas as indicated by the black circle in the bottom left corner, about 40% of the typical MOJAVE beam size. Overlay contours are shown at ten levels of peak percentage specified in the bottom of plots.
Current usage metrics show cumulative count of Article Views (full-text article views including HTML views, PDF and ePub downloads, according to the available data) and Abstracts Views on Vision4Press platform.
Data correspond to usage on the plateform after 2015. The current usage metrics is available 48-96 hours after online publication and is updated daily on week days.
Initial download of the metrics may take a while.