Fig. 3.
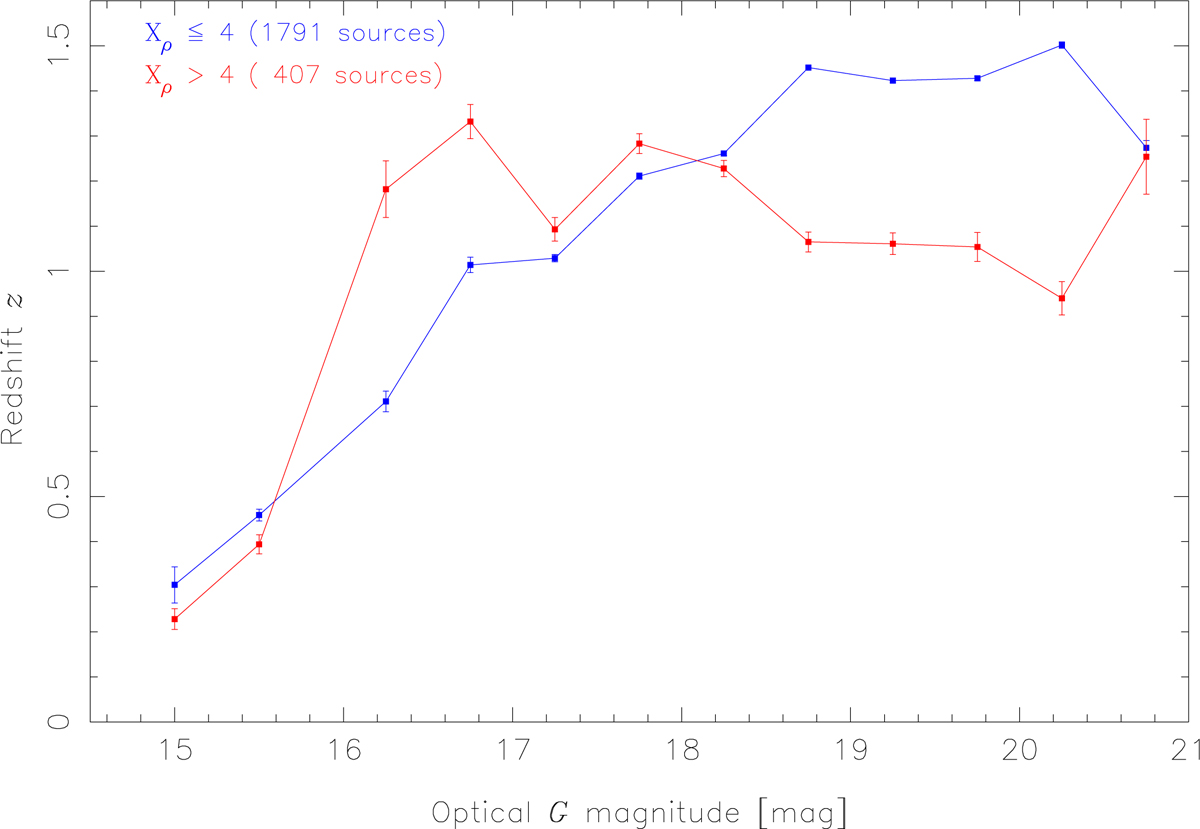
Mean redshift values with respect to the optical G magnitudes for the 2198 sources with available redshifts. The blue curve is for the sources with Xρ ≤ 4, and the red curve is for the sources with Xρ > 4. The error bars show the estimated uncertainties of the mean values. The bin windows of G are shown in the first column in Table 4. The sources with Xρ > 4 have substantially lower Z at G > 18.5 mag, but higher z at G ≃ 16.5 mag than the sources with Xρ ≤ 4. The statistics are shown in Tables 4 and 5.
Current usage metrics show cumulative count of Article Views (full-text article views including HTML views, PDF and ePub downloads, according to the available data) and Abstracts Views on Vision4Press platform.
Data correspond to usage on the plateform after 2015. The current usage metrics is available 48-96 hours after online publication and is updated daily on week days.
Initial download of the metrics may take a while.