Fig. 1.
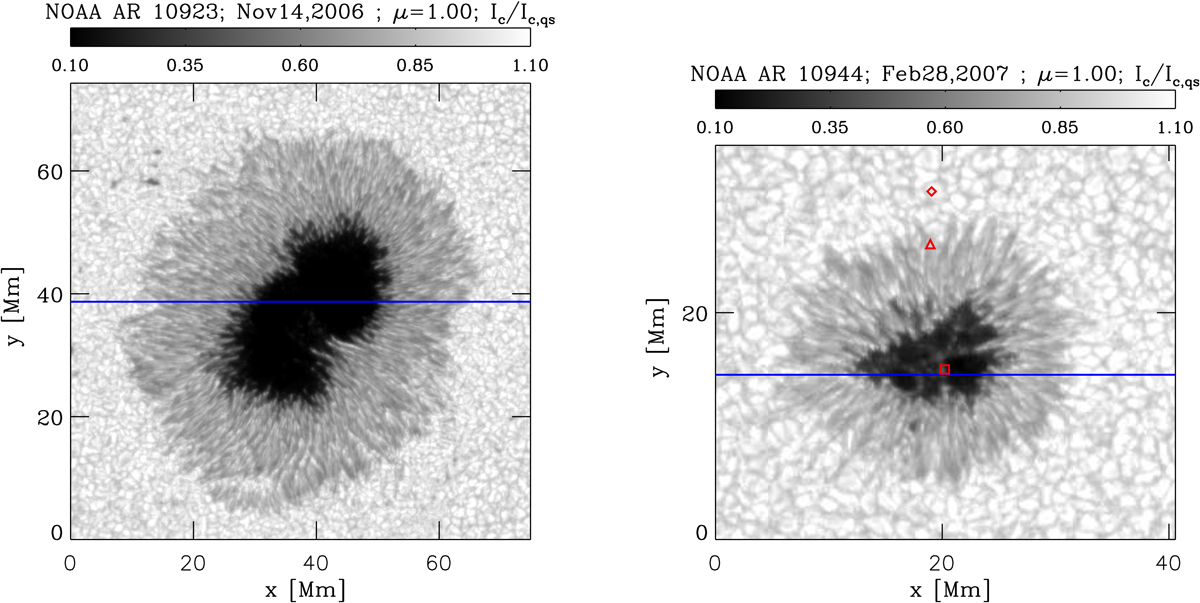
Maps of the normalized continuum intensity, Ic/Ic, qs, for the two sunspots analyzed in this work. Left: NOAA AR 10923 observed on November 14, 2006. Right: NOAA AR 10944 observed on February 28, 2007. At the time of the observations, both sunspots were located at disk center. Regions marked with red symbols and solid blue lines will be studied in more detail later on.
Current usage metrics show cumulative count of Article Views (full-text article views including HTML views, PDF and ePub downloads, according to the available data) and Abstracts Views on Vision4Press platform.
Data correspond to usage on the plateform after 2015. The current usage metrics is available 48-96 hours after online publication and is updated daily on week days.
Initial download of the metrics may take a while.