| Issue |
A&A
Volume 647, March 2021
|
|
|---|---|---|
| Article Number | A11 | |
| Number of page(s) | 5 | |
| Section | Galactic structure, stellar clusters and populations | |
| DOI | https://doi.org/10.1051/0004-6361/202039888 | |
| Published online | 26 February 2021 | |
The structure of Small Magellanic Cloud star clusters
1
Instituto Interdisciplinario de Ciencias Básicas (ICB), CONICET-UNCUYO, Padre J. Contreras 1300, M5502JMA Mendoza, Argentina
e-mail: andres.piatti@unc.edu.ar
2
Consejo Nacional de Investigaciones Científicas y Técnicas (CONICET), Godoy Cruz 2290, C1425FQB Buenos Aires, Argentina
Received:
10
November
2020
Accepted:
7
January
2021
The variations in the structural parameters and the internal dynamical evolution of star clusters in the Milky Way and the Large Magellanic Cloud (LMC) caused by the different gravitational field strengths that they experience has been revealed thanks to recent observational data sets. We report here possible indications of such differential tidal effects in the structural parameters of star clusters in the Small Magellanic Cloud (SMC), which is nearly ten times less massive than the LMC. A key contribution to this study is the consideration of the SMC as a triaxial spheroid; from this, we estimate the de-projected distances to the SMC center of the statistically significant sample of analyzed star clusters. By adopting a 3D geometry of the SMC, we avoid the spurious effects caused by assuming that a star cluster observed along the line-of-sight is close to the galactic center. When inspecting the relationships between the de-projected distances and the star cluster sizes (represented by the 90% light radii), their eccentricities, masses, and ages, we find: (i) The star cluster sizes are not visibly affected by tidal effects, because relatively small and large objects are spread throughout the SMC body; (ii) star clusters with large eccentricities (≥0.4) are preferentially found at de-projected distances smaller than ∼7−8 kpc, although many star clusters with smaller eccentricities are also found occupying a similar volume; and (iii) star clusters more massive than log(M/M⊙) ∼ 4.0 are among the oldest star clusters, and they are generally found in the outermost SMC region with a relatively low level of flattening. These findings contrast with those of the more elongated, generally younger, less massive, and innermost star clusters.
Key words: methods: observational / Magellanic Clouds / galaxies: star clusters: general
© ESO 2021
1. Introduction
The structure of star clusters evolves over their lifetimes, mainly because of stellar evolution, two-body relaxation, and the tidal effects caused by the host galaxy’s gravitational field (e.g., Heggie & Hut 2003; Lamers et al. 2005; Kruijssen & Mieske 2009; Gieles et al. 2011; Webb et al. 2013, 2014; Shukirgaliyev et al. 2018). Although mass loss due to tidal heating has long been treated theoretically and from numerical simulations (e.g., Gnedin et al. 1999; Baumgardt & Makino 2003; Gieles et al. 2006; Lamers & Gieles 2006; Gieles & Baumgardt 2008; Kruijssen et al. 2011; Gieles & Renaud 2016), the magnitude of this phenomenon on different star clusters has been more difficult to measure. Indeed, the observed variations across the body of a galaxy in the core, half-mass, and Jacobi radii, in the cluster eccentricity, in the half-mass relaxation time, and in the cluster mass (among other star cluster parameters) have been studied relatively recently and only in a limited number of cases.
Piatti et al. (2019) analyzed the extent to which the shaping of the structural parameters and internal dynamics of the globular cluster population was caused by the effects of the Milky Way gravitational field. They employed a homogeneous, up-to-date data set with the kinematics, structural properties, and current and initial masses of 156 globular clusters and found that, in overall terms, cluster radii increase as the Milky Way potential weakens. Core radii increase at the lowest rate and Jacobi radii do so at the fastest rate, which implies that the innermost regions of globular clusters are less sensitive to changes in the tidal forces with the galactocentric distance. The Milky Way gravitational field also differentially accelerates the internal dynamical evolution of globular clusters, with those toward the bulge appearing dynamically older. Globular clusters with large orbital eccentricities and inclination angles experience a higher mass loss due to more tidal shocks at perigalacticon and during disk crossings (Piatti 2019).
Milky Way open clusters are also subject to tidal heating. Because they are younger than globular clusters, mass loss due to stellar evolution can be more important, particularly if they are younger than a few hundred million years, while two-body relaxation becomes important as the mass-loss rate due to stellar evolution continues to decrease (Lamers et al. 2005). Nevertheless, shocks with giant molecular clouds are known to be the dominant source of mass loss over the lifetime of the open cluster (Lamers & Gieles 2006). Joshi et al. (2016) studied a statistically complete sample of open clusters located within 1.8 kpc of the Sun and found that their present-day masses follow a linear relationship with their respective ages. Assuming that the gravitational field does not vary significantly within such a circle, stellar evolution could be responsible for such a trend.
The Large Magellanic Cloud (LMC) is nearly ten times less massive than the Milky Way (Deason et al. 2021), and differential tidal effects are also seen within its population of globular clusters. Piatti & Mackey (2018) built extended stellar density and/or surface brightness radial profiles for almost all the known LMC globular clusters and found that those located closer than ∼5 kpc to the LMC center contain an excess of stars in their outermost regions with respect to the stellar density expected from a King profile; this excess is not seen in globular clusters located more than ∼5 kpc from the LMC center. In addition, globular cluster sizes show a clear dependence on their positions in the galaxy in the sense that the closer a globular cluster is to the LMC center, the smaller its size is. Although the masses of the LMC globular clusters are commensurate, the outermost regions of globular clusters located closer than ∼5 kpc to the LMC center seem to have evolved faster dynamically. As the globular clusters have orbited the LMC at different mean distances from its center along their lifetimes, the distinctions in their structural properties reflect the differential tidal effects between them.
We wonder whether tidal heating still plays an important role in the structural parameters of star clusters in galaxies less massive than the LMC. We focus here on the Small Magellanic Cloud (SMC), which is nearly ten times less massive than the LMC (van der Marel & Kallivayalil 2014; Stanimirović et al. 2004), because it has a statistically complete sample of studied star clusters that allows us to explore this issue. Gieles et al. (2007) analyzed a sample of 195 star clusters in the SMC and found no evidence for cluster tidal dissolution in the first gigayear. They arrived at this conclusion by comparing the observed star cluster frequency with that predicted by stellar evolutionary models, assuming no tidal dissolution.
The paper is organized as follows. In Sect. 2, we present the data set used and the different star cluster parameters obtained from it. Section 3 deals with the analysis of the variation in structural parameters as a function of the star cluster distance to the SMC center. Finally, Sect. 4 summarizes the main results of this work.
2. SMC star cluster properties
We gathered information from two main sources: the recent catalog of star clusters compiled by Bica et al. (2020), from which we retrieved star cluster ages, and Table 2 of Hill & Zaritsky (2006), from which we used star cluster coordinates (right ascension, RA, and declination, Dec), 90% light radii (r90), integrated V magnitudes, and cluster eccentricities (ϵ). We would like to note that different SMC imaging surveys have been carried out since the Magellanic Clouds Photometric Survey (Zaritsky et al. 2002) used by Hill & Zaritsky (2006), for example, VMC (Cioni et al. 2011), OGLE (Udalski et al. 2015), SMASH (Nidever et al. 2017), and VISCACHA (Maia et al. 2019). As far as we are aware, none of these surveys have been exploited to update the parameters derived in Hill & Zaritsky (2006) or their analysis, which justifies our choice. We computed the cluster masses using the relationships obtained by Maia et al. (2014, Eq. (4)) as follows:

where a = 5.87 ± 0.07, b = 0.608 ± 0.008 for a representative SMC overall metallicity of Z = 0.004 (Piatti & Geisler 2013), and MV⊙ = 4.83. Typical uncertainties turned out to be σ(log(M/M⊙)) ≈ 0.2. We note that the assumption of a single average metallicity for all star clusters does not affect their calculated masses since metallicity differences imply mass values that are within the uncertainties (see Figs. 10 and 11 in Maia et al. 2014). We checked that our cluster masses are in very good agreement with those calculated by Hill & Zaritsky (2006, see their Fig. 16). As for the completeness of the present star cluster sample, we refer the reader to the work by Gieles et al. (2007), which shows that the sample is magnitude-limited.
As far as we are aware, the frequent geometry considered to analyze the spatial distributions of SMC star clusters is the elliptical framework that was proposed by Piatti et al. (2007) as a simple representation of the orientation, dimension, and shape of the SMC main body. This framework does not consider the SMC depth, which is much more extended than the size of the galaxy projected in the sky (Ripepi et al. 2017; Muraveva et al. 2018; Graczyk et al. 2020). In an attempt to represent the main body of the SMC more realistically, we devised a 3D geometry, considering the SMC as an ellipsoid, as follows:
where the x and y directions are along the semiminor and semimajor axes in the Piatti et al. (2007) framework, respectively, and the z axis is along the line-of-sight. The SMC center is adopted as the origin of this framework, namely (RASMC,DecSMC) = ( ) (Piatti et al. 2007). The projected ellipses in the sky have a position angle PASMC = 54° and an a/b ratio of 1/2.
The PAs of the star clusters in this rotated coordinate system were calculated using the positionAngle routine from PyAstronomy1 (PyA, Czesla et al. 2019) and the observed distances in the sky to the SMC center in RA (x0) and Dec (y0), respectively, as follows:
We assumed that the spatial star cluster distribution is a function of the clusters’ ages (see Fig. 8 in Bica et al. 2020, and references therein), such that each ellipsoid corresponds to a fixed age. Using the age gradient in Fig. 8 from Bica et al. (2020), we entered the star clusters’ ages to estimate their corresponding semimajor axes. We additionally used a mean SMC distance of 62.5 kpc (Graczyk et al. 2020) and an average b/c ratio of 1:2.3 (Ripepi et al. 2017; Muraveva et al. 2018; Graczyk et al. 2020, and references therein) to find the projected distance r = (x2 + y2)1/2 and z values for which

where b (kpc) = 1.67 × log(age/yr) − 10.85 (age ≲ 5 Gyr) with a dispersion of 0.25 kpc representing the 95% confidence interval of the fitted parameters (Fig. 8 in Bica et al. 2020). Equation (2) comes from Eq. (1), x = r × sin(PA), y = r × cos(PA), a/b = 1/2, and b/c = 1/2.3. We note that if we do not consider the SMC depth (z = 0), then x = x0 and y = y0. The r and z values that comply with Eq. (2) for each star cluster were obtained by (i) evaluating Eq. (2) 17 600 times, from a grid of values of r from 0.0 up to 11.0 kpc, in steps of 0.1 kpc, and values of z from 0.0 up to 16.0 kpc, in steps of 0.1 kpc, and then (ii) looking for the r and z values that correspond to the smallest of the 17600 absolute values of Eq. (2), which were always smaller than 0.01. We note that, theoretically speaking, the resulting r and z values should lead Eq. (2) to be equal to zero. Finally, the linear distance of a star cluster to the SMC center is calculated as rdeproj = (r2 + z2)1/2. We estimated the uncertainties in rdeproj by performing the procedure described above for 1000 realizations with b values that were randomly chosen in the interval [b − σ(b), b + σ(b)]. Then, we adopted σ(rdeproj) = 1/2.355 times the full width at half maximum (FWHM) of the rdeproj distributions, which typically resulted to be ≈1 kpc. Figure 1 illustrates the projected spatial distribution of the star cluster sample where the different de-projected distances to the SMC center are revealed. Some star clusters projected close to the SMC center are relatively distance objects, while others apparently placed in the outer galaxy regions turned out to be closer to the SMC center.
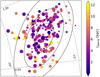 |
Fig. 1. Equal-area Hammer projection of the SMC in equatorial coordinates. Three ellipses with semimajor axes of 1°, 2°, and 3° are superimposed. Symbols are colored according to the star cluster distance to the SMC center, and their sizes are proportional to the star cluster 90% light radii. |
The analysis of the variations in structural star cluster parameters as a function of their de-projected distances to the SMC center supersedes previous analyses, which were based on the star cluster positions projected on the sky. As far as we are aware, there are very few SMC star clusters with independent distance estimates (see, e.g., Glatt et al. 2008; Dias et al. 2016). In general, a mean SMC distance modulus is adopted when fitting theoretical isochrones to the color-magnitude diagram (CMD) of a star cluster since changes in the distance modulus by an amount equivalent to the average SMC depth lead to a smaller age difference than that resulting from the isochrones (characterized by the same metallicity) bracketing the observed star cluster features in the CMD. Nevertheless, there are still differences between individual star cluster estimates. Glatt et al. (2008) estimated distances for NGC 121, Lindsay 1, and Kron 3 of 64.9 ± 1.2 kpc, 56.9 ± 1.0 kpc, and 60.4 ± 1.1, respectively, while Crowl et al. (2001) obtained 59.6 ± 1.8 kpc, 53.2 ± 0.9 kpc, and 56.7 ± 1.9 kpc, respectively.
3. Analysis and discussion
The different gravitational field strengths experienced by star clusters affect their structural parameters and, ultimately, their internal dynamical evolutionary stages. For example, the increase in core, half-mass, and Jacobi radii as a function of the star cluster’s distance from the Milky Way center was predicted theoretically by Hurley & Mackey (2010) and Bianchini et al. (2015), among others. Star clusters in weaker tidal fields, such as those located in the outermost regions of the Milky Way, can expand naturally, while those immersed in stronger tidal fields (e.g., the Milky Way bulge) do not. Here we used the calculated de-projected distances as a proxy for the SMC gravitational field to investigate whether some star cluster properties show any correlation with it.
Figure 2 shows the eccentricity versus de-projected distance plane for the studied star cluster sample, and some obvious features are apparent. The eccentricities span a wide range of values (0.0 < ϵ < 0.8) for de-projected distances ≲7−8 kpc from the SMC center. For larger de-projected distances, they span a significantly narrower range (0.0 < ϵ ≲ 0.4). This behavior seems to be independent of the star cluster size because relatively small and large objects are located throughout the whole covered SMC body (see Fig. 3). The morphology of star clusters can be shaped by different mechanisms, such as dynamical relaxation, the decay of initial velocity anisotropy, cluster rotation, external perturbations, differential interstellar extinction, etc. (see Chen & Chen 2010, for a review). Milky Way globular clusters have a median eccentricity of ∼0.13; those close to the Galaxy bulge have various degrees of flattening, while those far from the Galactic center tend to be spherical. In the LMC, the globular cluster population shows evidence for radial variation of the cluster eccentricity (Kontizas et al. 1989), while Hill & Zaritsky (2006) find that the eccentricity of star clusters in the SMC correlates with their masses more strongly than with their ages. Figure 2 reveals that the correlation of the eccentricity with the star cluster mass is not apparent, because star clusters less massive than log(M/M⊙) ∼ 4.0 are distributed at any eccentricity. However, there is a hint that more massive star clusters have, in general terms, eccentricities smaller than 0.4. This would place massive SMC star clusters in a distinct group of objects.
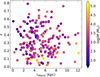 |
Fig. 2. Star cluster eccentricity versus de-projected distance from the SMC center, color-coded according to the star cluster mass. |
The two different eccentricity regimes mentioned above (for rdeproj smaller or larger than ∼7−8 kpc) also seem to be a distinguishing feature. We note here that because of the existence of an age gradient, these two eccentricity regimes could hide an eccentricity-age dependence.
The relationship between star cluster ages and the de-projected distances is shown in Fig. 3; some correlation can be seen, in the sense that the older the star cluster, the farther its location from the SMC center. However, the oldest star clusters are not the most distant ones to the SMC center but are somehow located in the midst of the de-projected distance range, where young star clusters are also seen. Such a mixture of star cluster ages along the de-projected distances is caused by the spheroidal geometry that is adopted to map the observed SMC structure and star cluster age gradient more tightly. For example, the plane z = 0.0 kpc contains old star clusters (the outermost ones in the plane of the sky) that are located comparatively close to the SMC center relative to younger star clusters observed along the line-of-sight.
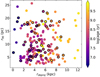 |
Fig. 3. Star cluster size (r90) versus de-projected distance from the SMC center, color-coded according to their ages. Star clusters with ϵ > 0.4 are highlighted with open black circles. |
Star clusters with eccentricities larger than ∼0.4 nearly span the whole age range, as those with smaller eccentricities do (see also Fig. 4). This is visible from the inspection of Fig. 3 for de-projected distances smaller than ∼7−8 kpc. Therefore, we do not find any support for an eccentricity-age dependence. This result is not in opposition to the fact that star clusters with eccentricities smaller than ∼0.4 and located at de-projected distances larger than ∼7−8 kpc are among the old SMC star clusters. It seems that there is a group of old massive star clusters located in the outermost SMC regions with relatively small eccentricities and that there is no correlation between eccentricity and a star cluster’s mass and age.
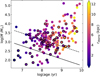 |
Fig. 4. Star cluster mass versus de-projected distance from the SMC center, color-coded according to their de-projected distances from the SMC center. Star clusters with ϵ > 0.4 are highlighted with open black circles. The straight solid line is the relationship found by Joshi et al. (2016) for Milky Way open clusters located within 1.8 kpc of the Sun, while the dashed and dotted lines parallel to that of Joshi et al. (2016) are drawn for comparison purposes (see the text for details). |
Figure 3 also tells us that the star cluster sizes do not show any correlation with the de-projected distances; that is to say, they are not affected by the SMC gravitation field, contrary to the Milky Way and LMC globular clusters (Piatti & Mackey 2018; Piatti et al. 2019), which are bigger as they are located farther from the galaxy center. This finding puts a limit on the galaxy mass, a value somewhere in between the LMC and the SMC mass, as the galaxy gravitational field can drive the size of its star clusters. We point out that old globular clusters in the Milky Way and the LMC are, on average, one order of magnitude more massive than the massive SMC star clusters (Piatti & Mackey 2018), so that the comparison between them could favor a minimum galaxy mass more similar to that of the LMC. This could also have its own impact on the computation of the cluster mass lost by tidal disruption along the entire lifetimes of star clusters stripped off the SMC by the LMC (Carpintero et al. 2013). In the standard cosmological scenario (Moore et al. 1999; D’Onghia & Lake 2008), accreted globular clusters are formed in small dwarf galaxies. Hence, most of the cluster mass lost by tidal disruption should have been disrupted once the star cluster is under the effects of the Milky Way gravitational field because low mass galaxies do not seem to seriously affect the mass budget of their massive globular clusters. Nevertheless, the large eccentricity values found only in SMC star clusters located inside a volume of radius ∼7−8 kpc implies some kind of distortion that might be caused by the SMC tidal forces. At this point, it is a conundrum that many star clusters distributed in a similar volume do not have large eccentricities (see also Fig. 2). We also point out that r90, although a robust estimate of the star cluster size, does not represent the cluster Jacobi radius, which should, strictly speaking, be considered for monitoring any change in the star cluster dimension with the de-projected distance. Typical errors in r90 are ∼30%.
The mass versus age diagram of SMC star clusters depicted in Fig. 4 shows that those with eccentricities larger than ∼0.4 are less massive than log(M/M⊙) ∼ 4.0. More massive star clusters have eccentricities smaller than ∼0.4 and seem to be among the oldest objects. We note, however, that not every old star cluster is more massive than log(M/M⊙) ∼ 4.0. Likewise, we wonder about the presence of many star clusters that are less massive than log(M/M⊙) ∼ 4.0 and have eccentricities smaller than ∼0.4. Some aspects worth considering in the search for an explanation, although beyond the scope of the present data sets, could be the existence of families of star clusters with different rotation velocities or a differential perturbation by the LMC during the last close passage to the SMC (Patel et al. 2020).
Figure 4 also shows that the cluster mass distribution as a function of age is quite different from that of Milky Way open clusters located in a circle of radius 1.8 kpc from the Sun (Joshi et al. 2016, solid line). In the case of these open clusters, we can assume that the mass variation as a function of their ages is mainly caused by evolutionary effects if the Milky Way gravitation field does not affect them differently in that relatively small circle. Furthermore, we can imagine straight lines parallel to that for the open clusters from Joshi et al. (2016) that correspond to star clusters under different tidal disruption regimes (Piatti et al. 2019), with those for weaker tidal fields located upward. Figure 4 shows a large number of SMC clusters that seem to follow a similar trend, shifted by Δ(log(M/M⊙)) ∼ 0.7 (dashed line) toward larger masses. This nearly constant log mass difference could reflect the much stronger tidal field of the Milky Way at the solar circle relative to that of the SMC, assuming that the SMC star clusters are affected by the same SMC tidal field strength. We note that such a trend is followed by star clusters that are several hundred megayears in age, for which mass loss is mainly driven by stellar evolution, as well as for some older star clusters, where two-body relaxation can play a more important role. Star clusters older than ∼1 Gyr hardly survived along the dashed line. However, if more massive star clusters had experienced mass loss by tidal disruption as those along the dashed line did, some of them would have been seen populating the region around the dashed line (log(age/yr) ≳ 9.3). The fact that old clusters appear above the dashed line could be interpreted as an indication that they are affected by weaker gravitational field strengths. We note that most of them have eccentricities ≲0.4 and are located at de-projected distances ≳7−8 kpc. The observed mass range at any age is Δ(log(M/M⊙)) ∼ 2.0.
4. Concluding remarks
We made use of available data sets of structural properties for a statistically significant sample of SMC star clusters with the aim of studying to what extend the SMC gravitational field is responsible for the star cluster shapes and sizes. The dependence of the core, half-mass, and Jacobi radii (as well as relaxation time, cluster mass loss by tidal disruption, etc.) on the position in the galaxy of old globular Milky Way and LMC clusters has recently been demonstrated. Although the SMC does not harbor star clusters as old as the ancient globular clusters, the spatial coverage of star clusters spanning the whole age range allows us to probe for tidal effects. Hill & Zaritsky (2006) performed an analysis of some structural properties of SMC star clusters. As far as we are aware, this is the first time that star cluster properties have been analyzed in the context of the 3D geometry of the SMC.
We adopted an ellipsoid as a representation of the SMC, with the three axes having different extensions. They were adjusted by combining the known star cluster age gradient and the SMC depth recently estimated from Classical Cepheids, RR Lyrae stars, and late-type eclipsing binaries. In this framework, each age is assigned to a unique ellipsoid. Therefore, by using the age of the star clusters and their projected positions in the sky with respect to the SMC center, we estimated their de-projected distances, which we used as a proxy for the SMC gravitational field. The use of de-projected distances solved the spurious effect problem that arises when considering a star cluster to be located close to the SMC center from its projected position in the sky.
We searched for any trend between the star cluster size (represented by the 90% light radius), eccentricity, mass, or age and the de-projected distance. We did find that the size of the star clusters seems to not be sensitive to changes in their positions in the galaxy, because star clusters spanning the entire observed range are found everywhere. We point out, however, that Jacobi radii would be appropriate for a more definitive answer. The star cluster eccentricities reveal that those more elongated objects (ϵ ≳ 0.4) are preferentially located at de-projected distances ≲7−8 kpc. This finding could be a hint of differential tidal effects between star clusters located closer and farther from the SMC center. However, we found a large population of star clusters distributed inside the same volume that appear less elongated (ϵ ≲ 0.4).
Star clusters with estimated masses larger than log(M/M⊙) ∼ 4.0 have relatively small eccentricities (ϵ ≲ 0.4), are older than log(age/yr) ∼ 9.0 (considering the uncertainties in their estimated masses), and are mostly located in the outermost regions of the SMC. We would like to stress that we initially assumed a dependence of de-projected distance and cluster mass on age. These features could favor a scenario of differential tidal effects. Likewise, a large number of star clusters located at de-projected distances ≲7−8 kpc mimic the linear cluster mass versus age relationship of Milky Way open clusters located within 1.8 kpc of the Sun, with a zero point offset of 0.7 toward more massive star clusters. We interpret this shift as originating from different gravitational field strengths.
Acknowledgments
I thank the referee for the thorough reading of the manuscript and timely suggestions to improve it.
References
- Baumgardt, H., & Makino, J. 2003, MNRAS, 340, 227 [NASA ADS] [CrossRef] [Google Scholar]
- Bianchini, P., Renaud, F., Gieles, M., & Varri, A. L. 2015, MNRAS, 447, L40 [Google Scholar]
- Bica, E., Westera, P., Kerber, L. D. O., et al. 2020, AJ, 159, 82 [CrossRef] [Google Scholar]
- Carpintero, D. D., Gómez, F. A., & Piatti, A. E. 2013, MNRAS, 435, L63 [Google Scholar]
- Chen, C. W., & Chen, W. P. 2010, ApJ, 721, 1790 [NASA ADS] [CrossRef] [Google Scholar]
- Cioni, M.-R. L., Clementini, G., Girardi, L., et al. 2011, A&A, 527, A116 [NASA ADS] [CrossRef] [EDP Sciences] [Google Scholar]
- Crowl, H. H., Sarajedini, A., Piatti, A. E., et al. 2001, AJ, 122, 220 [NASA ADS] [CrossRef] [Google Scholar]
- Czesla, S., Schröter, S., Schneider, C. P., et al. 2019, Astrophysics Source Code Library [record ascl:1906.010] [Google Scholar]
- Deason, A. J., Erkal, D., Belokurov, V., et al. 2021, MNRAS, 501, 5964 [Google Scholar]
- Dias, B., Kerber, L., Barbuy, B., Bica, E., & Ortolani, S. 2016, A&A, 591, A11 [NASA ADS] [CrossRef] [EDP Sciences] [Google Scholar]
- D’Onghia, E., & Lake, G. 2008, ApJ, 686, L61 [NASA ADS] [CrossRef] [Google Scholar]
- Gieles, M., & Baumgardt, H. 2008, MNRAS, 389, L28 [NASA ADS] [Google Scholar]
- Gieles, M., & Renaud, F. 2016, MNRAS, 463, L103 [Google Scholar]
- Gieles, M., Portegies Zwart, S. F., Baumgardt, H., et al. 2006, MNRAS, 371, 793 [NASA ADS] [CrossRef] [Google Scholar]
- Gieles, M., Lamers, H. J. G. L. M., & Portegies Zwart, S. F. 2007, ApJ, 668, 268 [NASA ADS] [CrossRef] [Google Scholar]
- Gieles, M., Heggie, D. C., & Zhao, H. 2011, MNRAS, 413, 2509 [NASA ADS] [CrossRef] [Google Scholar]
- Glatt, K., Grebel, E. K., Sabbi, E., et al. 2008, AJ, 136, 1703 [NASA ADS] [CrossRef] [Google Scholar]
- Gnedin, O. Y., Lee, H. M., & Ostriker, J. P. 1999, ApJ, 522, 935 [NASA ADS] [CrossRef] [Google Scholar]
- Graczyk, D., Pietrzynski, G., Thompson, I. B., et al. 2020, ApJ, 904, 13 [Google Scholar]
- Heggie, D., & Hut, P. 2003, The Gravitational Million-Body Problem: A Multidisciplinary Approach to Star Cluster Dynamics (Cambridge: Cambridge University Press) [CrossRef] [Google Scholar]
- Hill, A., & Zaritsky, D. 2006, AJ, 131, 414 [NASA ADS] [CrossRef] [Google Scholar]
- Hurley, J. R., & Mackey, A. D. 2010, MNRAS, 408, 2353 [NASA ADS] [CrossRef] [Google Scholar]
- Joshi, Y. C., Dambis, A. K., Pandey, A. K., & Joshi, S. 2016, A&A, 593, A116 [NASA ADS] [CrossRef] [EDP Sciences] [Google Scholar]
- Kontizas, E., Kontizas, M., Sedmak, G., & Smareglia, R. 1989, AJ, 98, 590 [Google Scholar]
- Kruijssen, J. M. D., & Mieske, S. 2009, A&A, 500, 785 [NASA ADS] [CrossRef] [EDP Sciences] [Google Scholar]
- Kruijssen, J. M. D., Pelupessy, F. I., Lamers, H. J. G. L. M., Portegies Zwart, S. F., & Icke, V. 2011, MNRAS, 414, 1339 [NASA ADS] [CrossRef] [Google Scholar]
- Lamers, H. J. G. L. M., & Gieles, M. 2006, A&A, 455, L17 [NASA ADS] [CrossRef] [EDP Sciences] [Google Scholar]
- Lamers, H. J. G. L. M., Gieles, M., Bastian, N., et al. 2005, A&A, 441, 117 [NASA ADS] [CrossRef] [EDP Sciences] [Google Scholar]
- Maia, F. F. S., Piatti, A. E., & Santos, J. F. C. 2014, MNRAS, 437, 2005 [NASA ADS] [CrossRef] [Google Scholar]
- Maia, F. F. S., Dias, B., Santos, J. F. C., et al. 2019, MNRAS, 484, 5702 [Google Scholar]
- Moore, B., Ghigna, S., Governato, F., et al. 1999, ApJ, 524, L19 [Google Scholar]
- Muraveva, T., Subramanian, S., Clementini, G., et al. 2018, MNRAS, 473, 3131 [Google Scholar]
- Nidever, D. L., Olsen, K., Walker, A. R., et al. 2017, AJ, 154, 199 [Google Scholar]
- Patel, E., Kallivayalil, N., Garavito-Camargo, N., et al. 2020, ApJ, 893, 121 [CrossRef] [Google Scholar]
- Piatti, A. E. 2019, ApJ, 882, 98 [NASA ADS] [CrossRef] [Google Scholar]
- Piatti, A. E., & Geisler, D. 2013, AJ, 145, 17 [NASA ADS] [CrossRef] [Google Scholar]
- Piatti, A. E., & Mackey, A. D. 2018, MNRAS, 478, 2164 [NASA ADS] [CrossRef] [Google Scholar]
- Piatti, A. E., Sarajedini, A., Geisler, D., Clark, D., & Seguel, J. 2007, MNRAS, 377, 300 [NASA ADS] [CrossRef] [Google Scholar]
- Piatti, A. E., Webb, J. J., & Carlberg, R. G. 2019, MNRAS, 489, 4367 [NASA ADS] [CrossRef] [Google Scholar]
- Ripepi, V., Cioni, M.-R. L., Moretti, M. I., et al. 2017, MNRAS, 472, 808 [NASA ADS] [CrossRef] [Google Scholar]
- Shukirgaliyev, B., Parmentier, G., Just, A., & Berczik, P. 2018, ApJ, 863, 171 [NASA ADS] [CrossRef] [Google Scholar]
- Stanimirović, S., Staveley-Smith, L., & Jones, P. A. 2004, ApJ, 604, 176 [NASA ADS] [CrossRef] [Google Scholar]
- Udalski, A., Szymański, M. K., & Szymański, G. 2015, Acta Astron., 65, 1 [NASA ADS] [Google Scholar]
- van der Marel, R. P., & Kallivayalil, N. 2014, ApJ, 781, 121 [NASA ADS] [CrossRef] [Google Scholar]
- Webb, J. J., Harris, W. E., Sills, A., & Hurley, J. R. 2013, ApJ, 764, 124 [NASA ADS] [CrossRef] [Google Scholar]
- Webb, J. J., Sills, A., Harris, W. E., & Hurley, J. R. 2014, MNRAS, 445, 1048 [NASA ADS] [CrossRef] [Google Scholar]
- Zaritsky, D., Harris, J., Thompson, I. B., Grebel, E. K., & Massey, P. 2002, AJ, 123, 855 [Google Scholar]
All Figures
|
Fig. 1. Equal-area Hammer projection of the SMC in equatorial coordinates. Three ellipses with semimajor axes of 1°, 2°, and 3° are superimposed. Symbols are colored according to the star cluster distance to the SMC center, and their sizes are proportional to the star cluster 90% light radii. |
| In the text | |
|
Fig. 2. Star cluster eccentricity versus de-projected distance from the SMC center, color-coded according to the star cluster mass. |
| In the text | |
|
Fig. 3. Star cluster size (r90) versus de-projected distance from the SMC center, color-coded according to their ages. Star clusters with ϵ > 0.4 are highlighted with open black circles. |
| In the text | |
|
Fig. 4. Star cluster mass versus de-projected distance from the SMC center, color-coded according to their de-projected distances from the SMC center. Star clusters with ϵ > 0.4 are highlighted with open black circles. The straight solid line is the relationship found by Joshi et al. (2016) for Milky Way open clusters located within 1.8 kpc of the Sun, while the dashed and dotted lines parallel to that of Joshi et al. (2016) are drawn for comparison purposes (see the text for details). |
| In the text | |
Current usage metrics show cumulative count of Article Views (full-text article views including HTML views, PDF and ePub downloads, according to the available data) and Abstracts Views on Vision4Press platform.
Data correspond to usage on the plateform after 2015. The current usage metrics is available 48-96 hours after online publication and is updated daily on week days.
Initial download of the metrics may take a while.