Fig. 4.
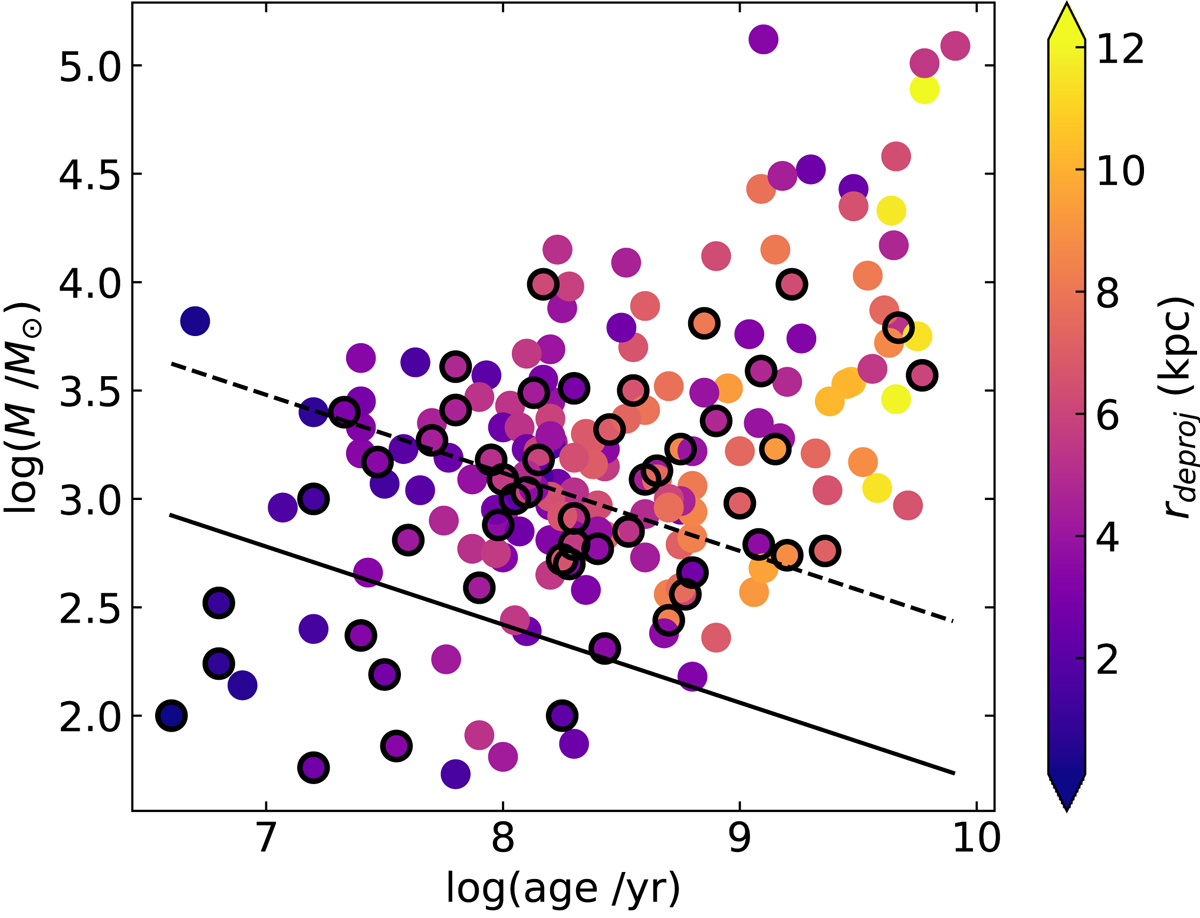
Star cluster mass versus de-projected distance from the SMC center, color-coded according to their de-projected distances from the SMC center. Star clusters with ϵ > 0.4 are highlighted with open black circles. The straight solid line is the relationship found by Joshi et al. (2016) for Milky Way open clusters located within 1.8 kpc of the Sun, while the dashed and dotted lines parallel to that of Joshi et al. (2016) are drawn for comparison purposes (see the text for details).
Current usage metrics show cumulative count of Article Views (full-text article views including HTML views, PDF and ePub downloads, according to the available data) and Abstracts Views on Vision4Press platform.
Data correspond to usage on the plateform after 2015. The current usage metrics is available 48-96 hours after online publication and is updated daily on week days.
Initial download of the metrics may take a while.