Fig. 6.
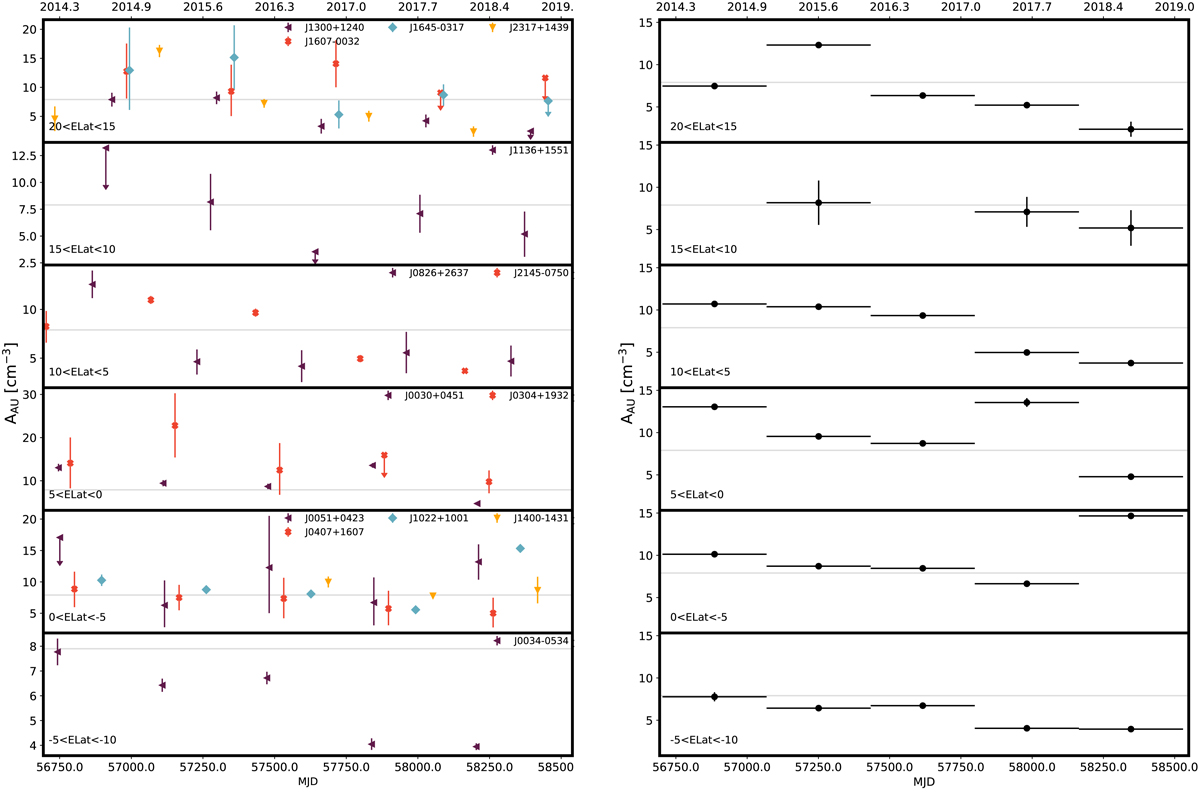
Temporal trend of the amplitude for the SW spherical model, divided into bins of ecliptic latitude, for the individual pulsars (left panel) and averaged year by year (right panel). The gray line marks an amplitude of 7.9 cm−3 (the best-fit value from Madison et al. 2019). All data points are shown with vertical error bars. The upper limits are displayed at the levels of the 95th percentile of the posterior distribution in the left panel and are not considered in the right panel.
Current usage metrics show cumulative count of Article Views (full-text article views including HTML views, PDF and ePub downloads, according to the available data) and Abstracts Views on Vision4Press platform.
Data correspond to usage on the plateform after 2015. The current usage metrics is available 48-96 hours after online publication and is updated daily on week days.
Initial download of the metrics may take a while.