Fig. 3.
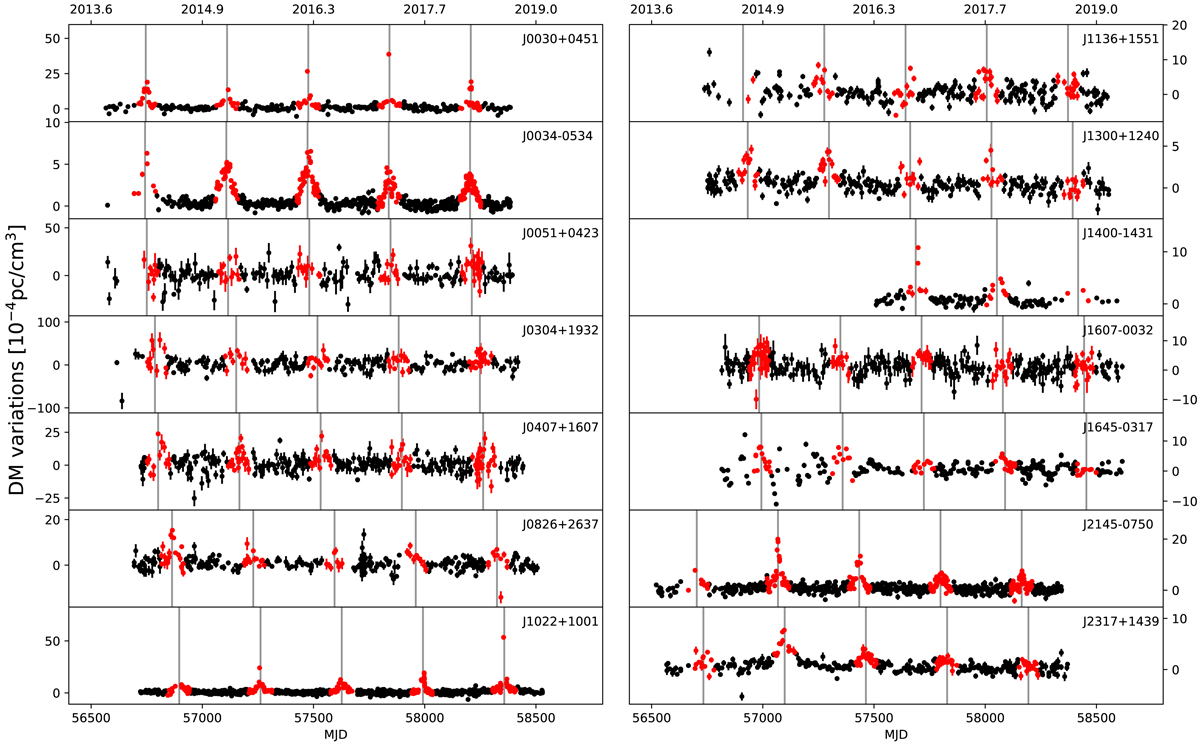
DM time series of the selected pulsars after subtraction of the IISM component. Observations highlighted in red were taken when the Solar elongation of the source was < 50°, and the gray vertical lines mark the modified Julian dates (MJDs) of the Solar conjunctions. For the sake of visual clarity, these plots show only 95% of the most precise measurements, although all data points are used in the analysis.
Current usage metrics show cumulative count of Article Views (full-text article views including HTML views, PDF and ePub downloads, according to the available data) and Abstracts Views on Vision4Press platform.
Data correspond to usage on the plateform after 2015. The current usage metrics is available 48-96 hours after online publication and is updated daily on week days.
Initial download of the metrics may take a while.