Fig. 2.
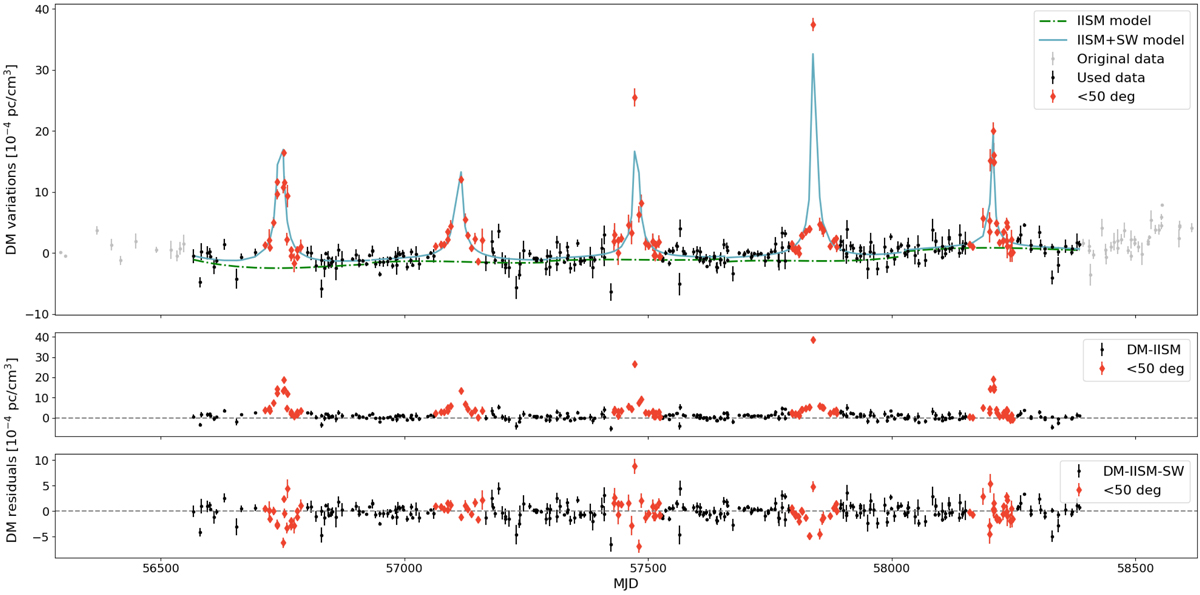
IISM-SW disentanglement in PSR J0030+0451. The upper panel shows the time series of the DM variations and the IISM models (dot-dashed green line) and of the SW and IISM combined (solid blue line). The data used are represented as black dots and red diamonds (where the red diamonds indicate the observations within 50° in Solar elongation and the black dots indicate the observations beyond 50°), while the discarded data points are in gray. Middle panel: DM residuals after subtraction of the IISM model only, and the lowest panel shows the DM residuals after subtraction of both the IISM and the SW models.
Current usage metrics show cumulative count of Article Views (full-text article views including HTML views, PDF and ePub downloads, according to the available data) and Abstracts Views on Vision4Press platform.
Data correspond to usage on the plateform after 2015. The current usage metrics is available 48-96 hours after online publication and is updated daily on week days.
Initial download of the metrics may take a while.