Fig. 9
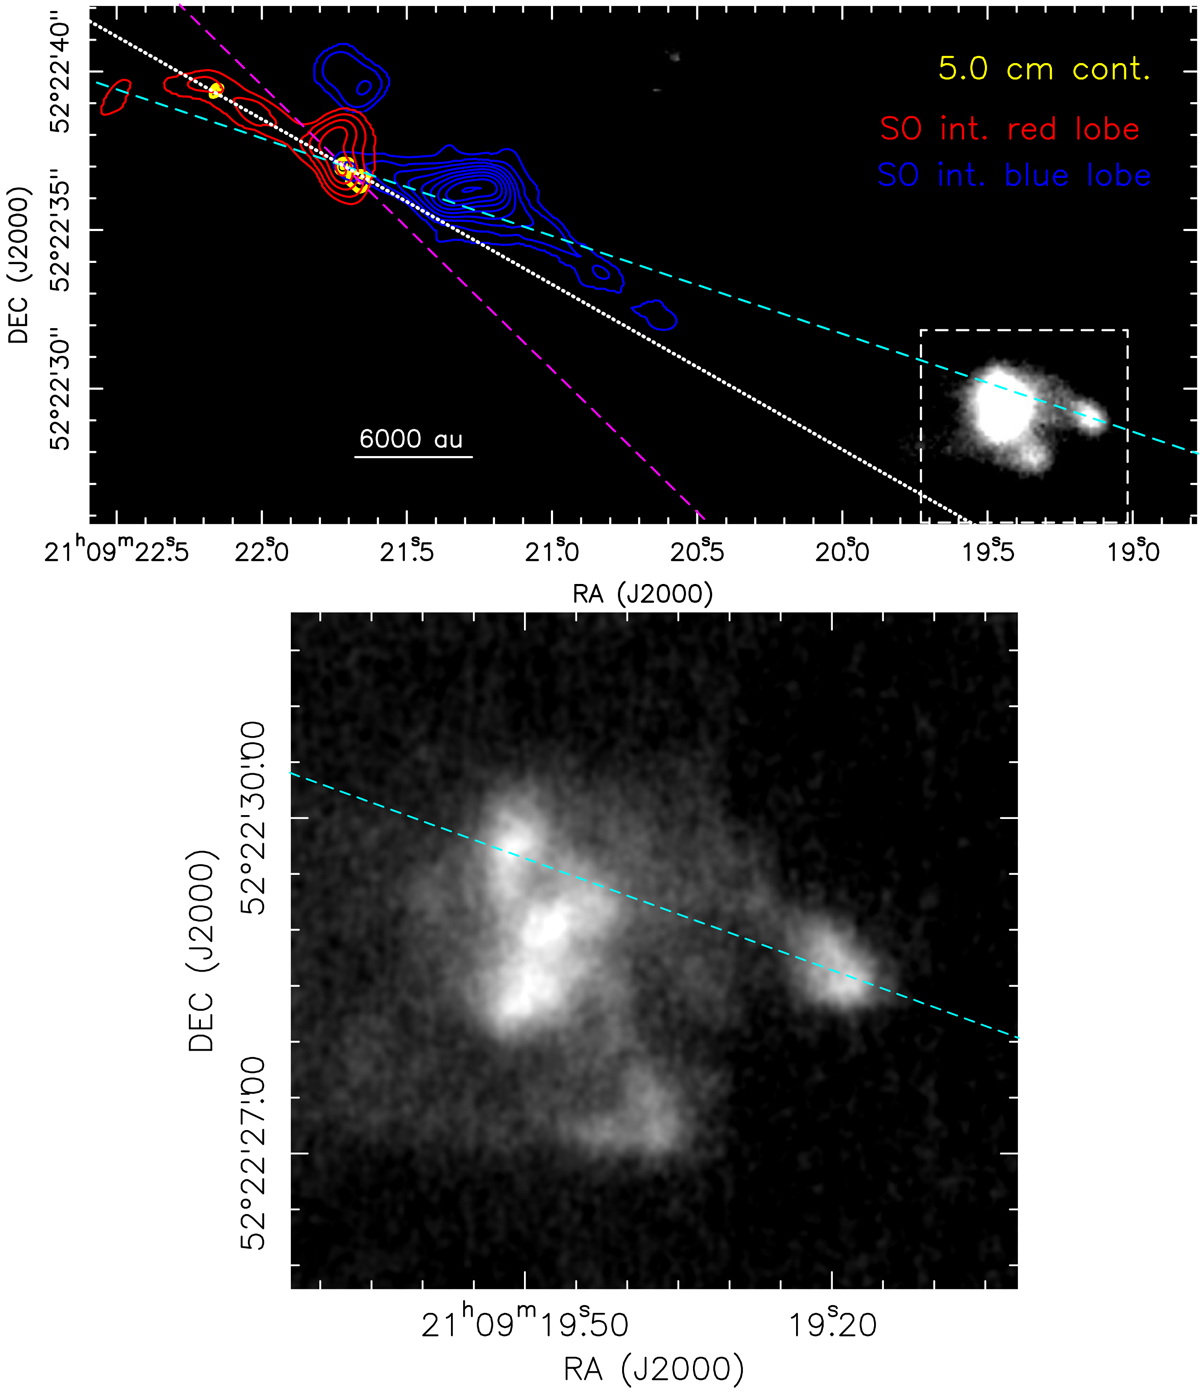
Comparison of CORE, POETS and LBT observations. Upper panel: the gray-scale map reproduces the H2 2.12 μm emission observed with LBT toward IRAS 21078+5211. Referring to Fig. 5, lower panel, the blue and red contours have the same meaning, and the yellow contours replace the magenta contours for the JVLA 5 cm continuum. The magenta dashed, white dotted, and cyan dashed lines connect the main 5 cm peak with the secondary (nearby) 5 cm peak, the weak 5 cm spur to NE, and the bow shock traced by the LBT H2 2.12 μm emissionto SW, respectively. The white dashed box delimits the region plotted in the lower panel. Lower panel: adaptive-optics assisted LBT observations of the H2 2.12 μm emission (gray-scale map): the cyan dashed line has the same meaning as in the upper panel.
Current usage metrics show cumulative count of Article Views (full-text article views including HTML views, PDF and ePub downloads, according to the available data) and Abstracts Views on Vision4Press platform.
Data correspond to usage on the plateform after 2015. The current usage metrics is available 48-96 hours after online publication and is updated daily on week days.
Initial download of the metrics may take a while.