Fig. 8
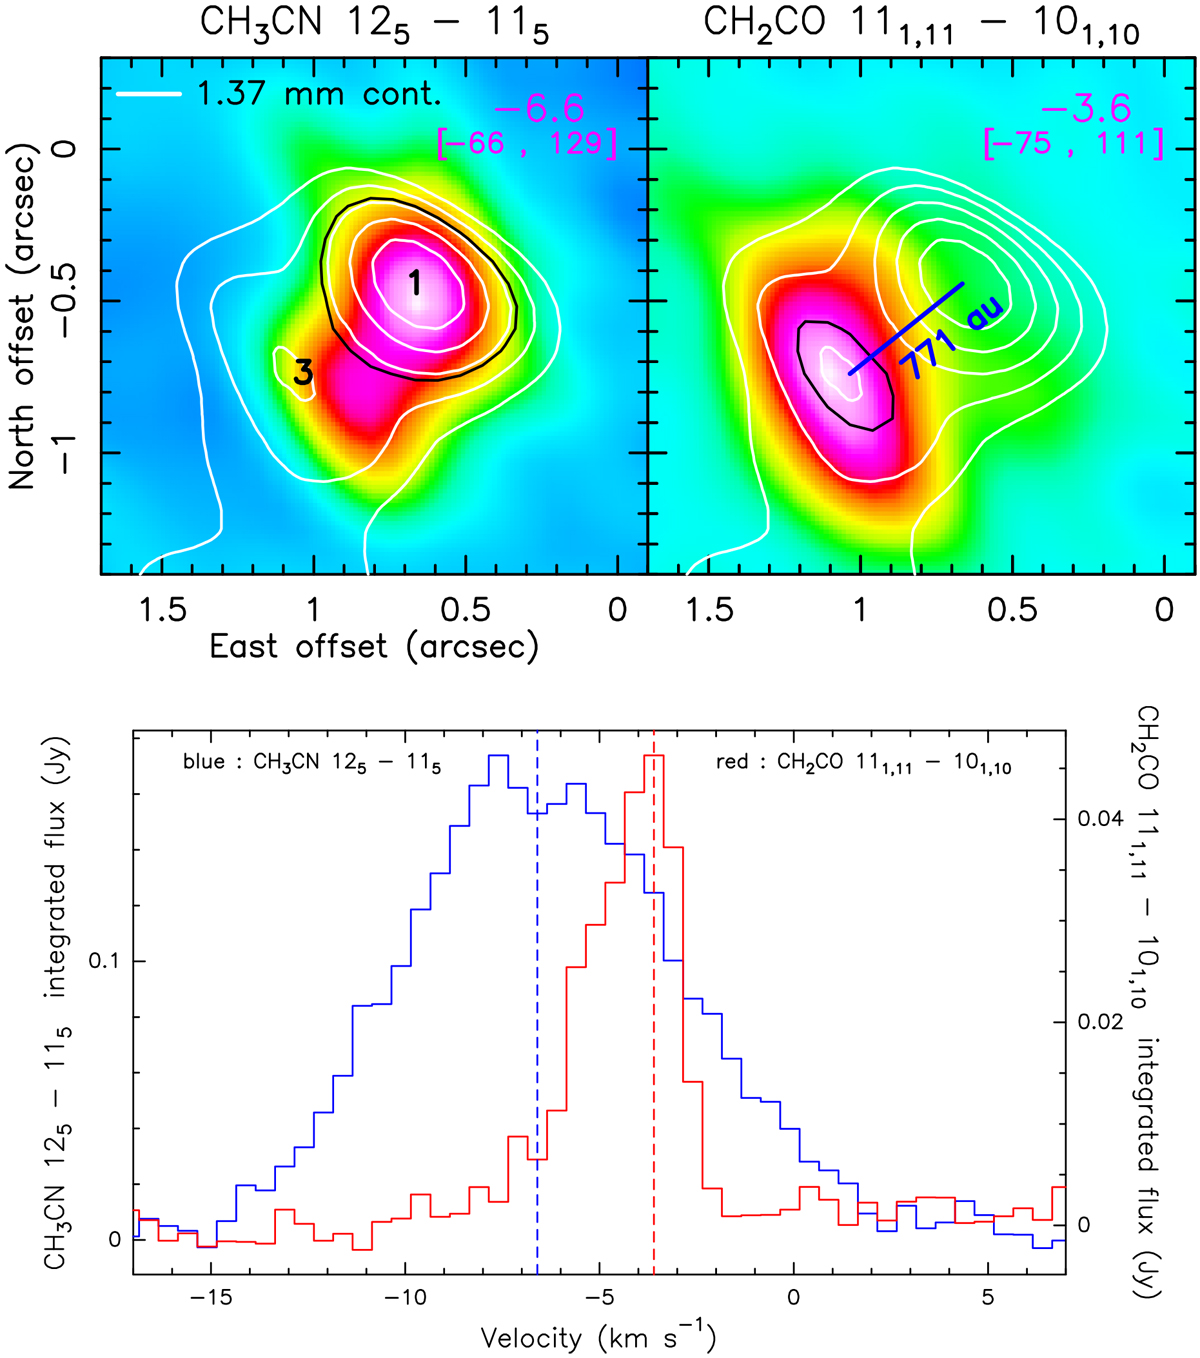
NOEMA data. Upper panels: the color maps reproduce the emission of the CH3 CN JK = 125–115 (left) and CH2CO ![]() 111,11–101,10
(right) lines. In the upper right corner of the panel, the channel VLSR (in kilometer per second) and the range of plotted values (in milliJansky per beam) are reported. The white contours reproduce the 1.37 mm continuum, with the same levels as in Fig. 7: the positions of the two nearby 1.37 mm peaks are denoted using the same labels as in Beuther et al. (2018, see Table 5), namely, 1 and 3 for the primary and secondary peak, respectively. Right panel: the blue segment connects the two peaks. In the two panels, the black contours delimit the integration areas used to produce the spectra toward cores 1 and 3, presented in the lower panel. Lower panel: spectra of the CH3 CN JK = 125–115
line toward core 1 (blue histogram) and the CH2CO
111,11–101,10
(right) lines. In the upper right corner of the panel, the channel VLSR (in kilometer per second) and the range of plotted values (in milliJansky per beam) are reported. The white contours reproduce the 1.37 mm continuum, with the same levels as in Fig. 7: the positions of the two nearby 1.37 mm peaks are denoted using the same labels as in Beuther et al. (2018, see Table 5), namely, 1 and 3 for the primary and secondary peak, respectively. Right panel: the blue segment connects the two peaks. In the two panels, the black contours delimit the integration areas used to produce the spectra toward cores 1 and 3, presented in the lower panel. Lower panel: spectra of the CH3 CN JK = 125–115
line toward core 1 (blue histogram) and the CH2CO ![]() 111,11–101,10
line toward core 3 (red histogram). The flux scales for the CH3CN and CH2CO spectra are reported on the left and right, vertical axes, respectively. The blue and red dashed vertical lines indicate the approximateVLSR of the cores 1 and 3, respectively.
111,11–101,10
line toward core 3 (red histogram). The flux scales for the CH3CN and CH2CO spectra are reported on the left and right, vertical axes, respectively. The blue and red dashed vertical lines indicate the approximateVLSR of the cores 1 and 3, respectively.
Current usage metrics show cumulative count of Article Views (full-text article views including HTML views, PDF and ePub downloads, according to the available data) and Abstracts Views on Vision4Press platform.
Data correspond to usage on the plateform after 2015. The current usage metrics is available 48-96 hours after online publication and is updated daily on week days.
Initial download of the metrics may take a while.