Fig. 7
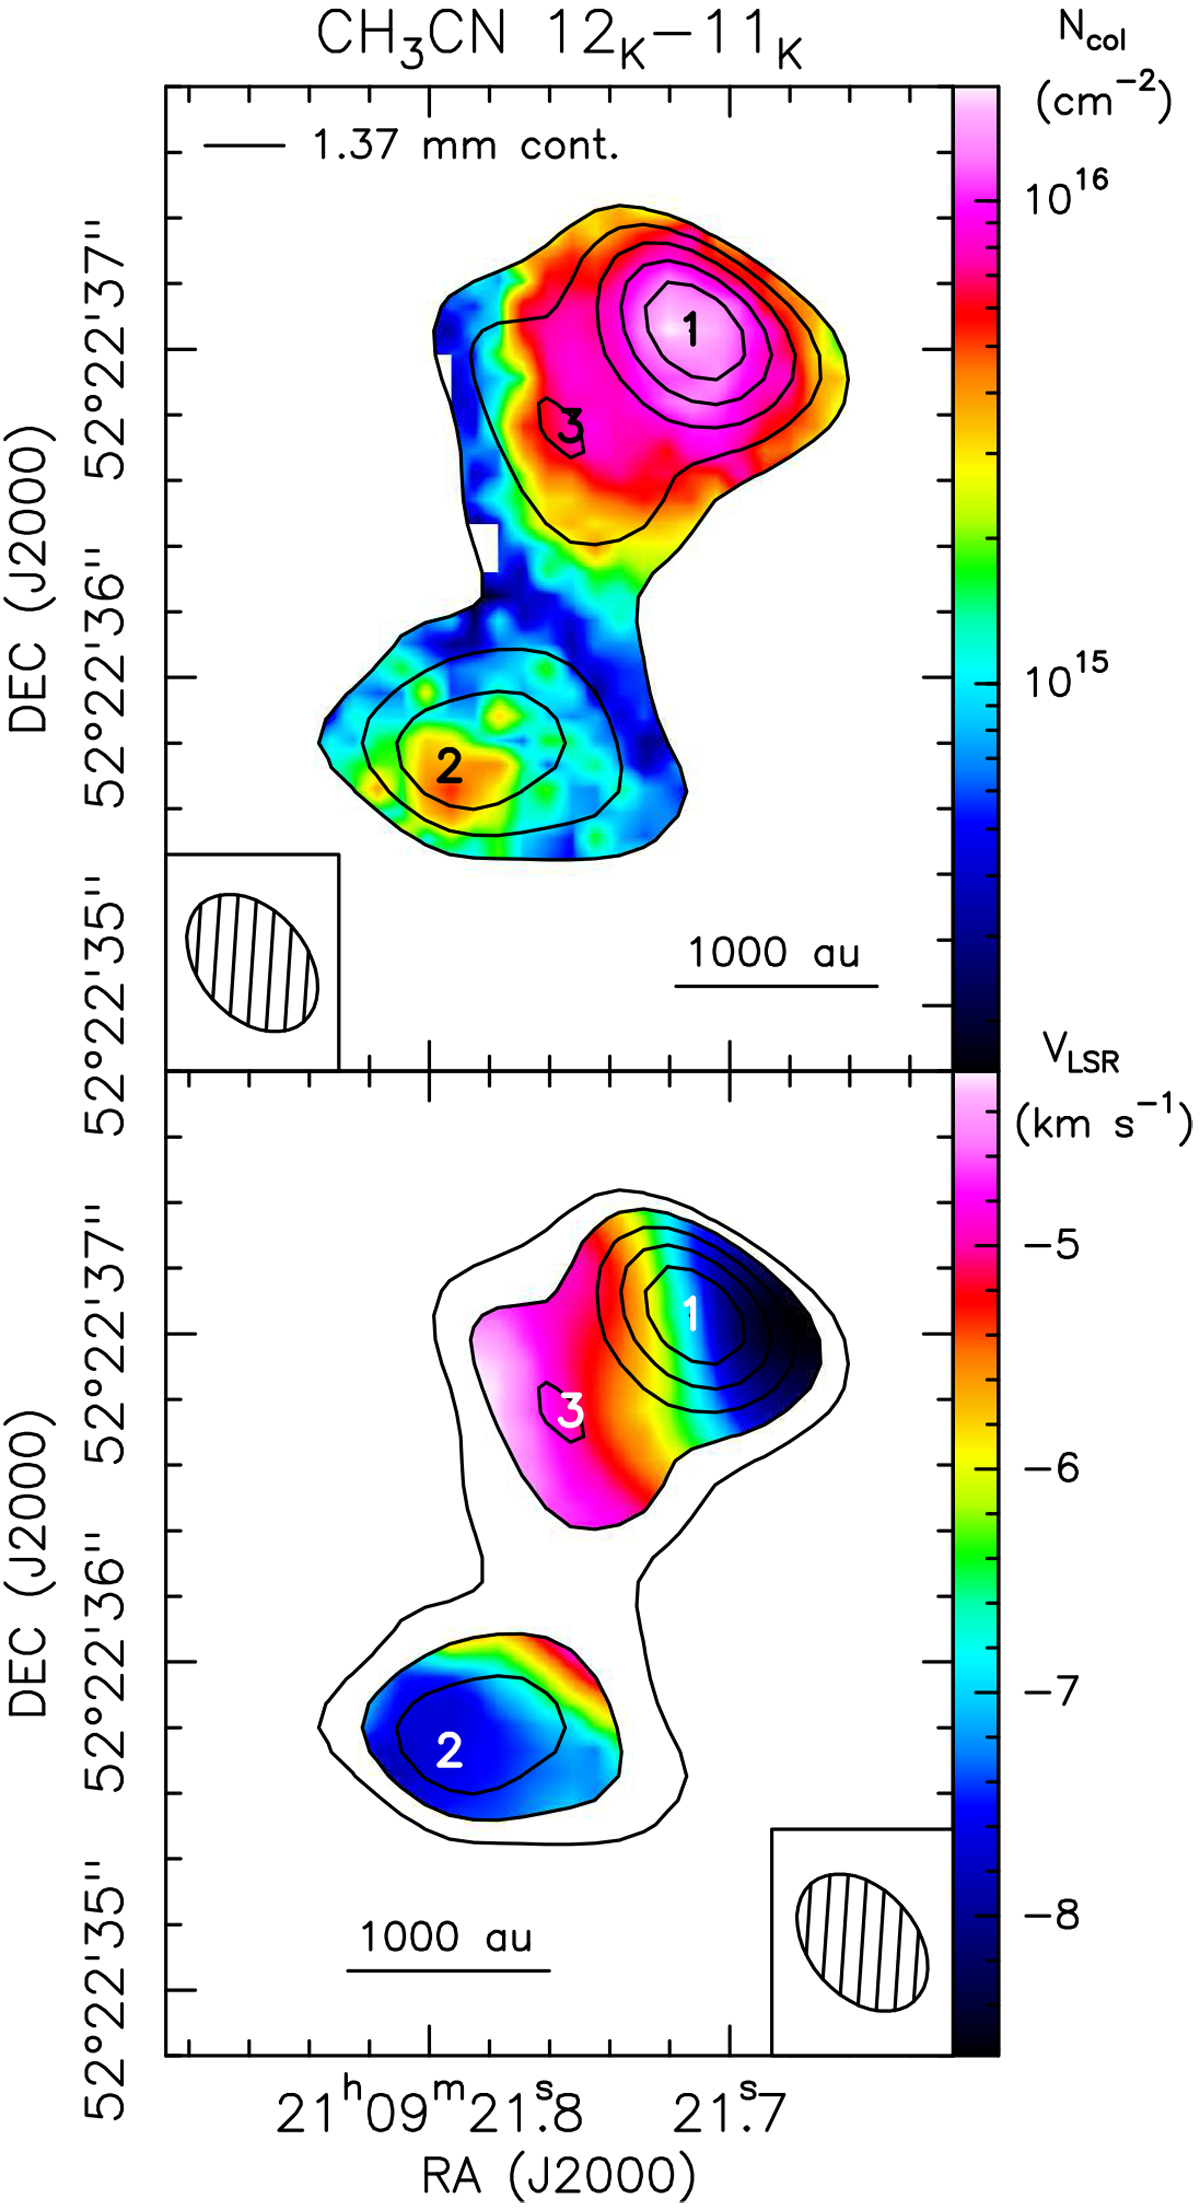
NOEMA data. The color map reproduces the column density (upper panel) and the velocity (lower panel) of the CH3 CN emission determined by fitting with XCLASS the CH3CN JK = 12K–11K (K = 0–6) lines (including the CH3 13CN isotopologs), simultaneously. The plotted regions correspond to the areas in which the 1.37 mm continuum emission is higher than 13 and 16 mJy beam−1 for the column density and velocity plots, respectively. The 1.37 mm continuum emission is represented with black contours, showing six levels increasing logarithmically from 13 to 35 mJy beam−1: the positions of the three strongest 1.37 mm peaks are denoted using the same labels as in Beuther et al. (2018, see Table 5). The restoring beams of the 1.37 mm continuum and CH3 CN maps are shown in the lower left corner of the upper panel and lower right corner of the lower panel, respectively.
Current usage metrics show cumulative count of Article Views (full-text article views including HTML views, PDF and ePub downloads, according to the available data) and Abstracts Views on Vision4Press platform.
Data correspond to usage on the plateform after 2015. The current usage metrics is available 48-96 hours after online publication and is updated daily on week days.
Initial download of the metrics may take a while.