Fig. 5
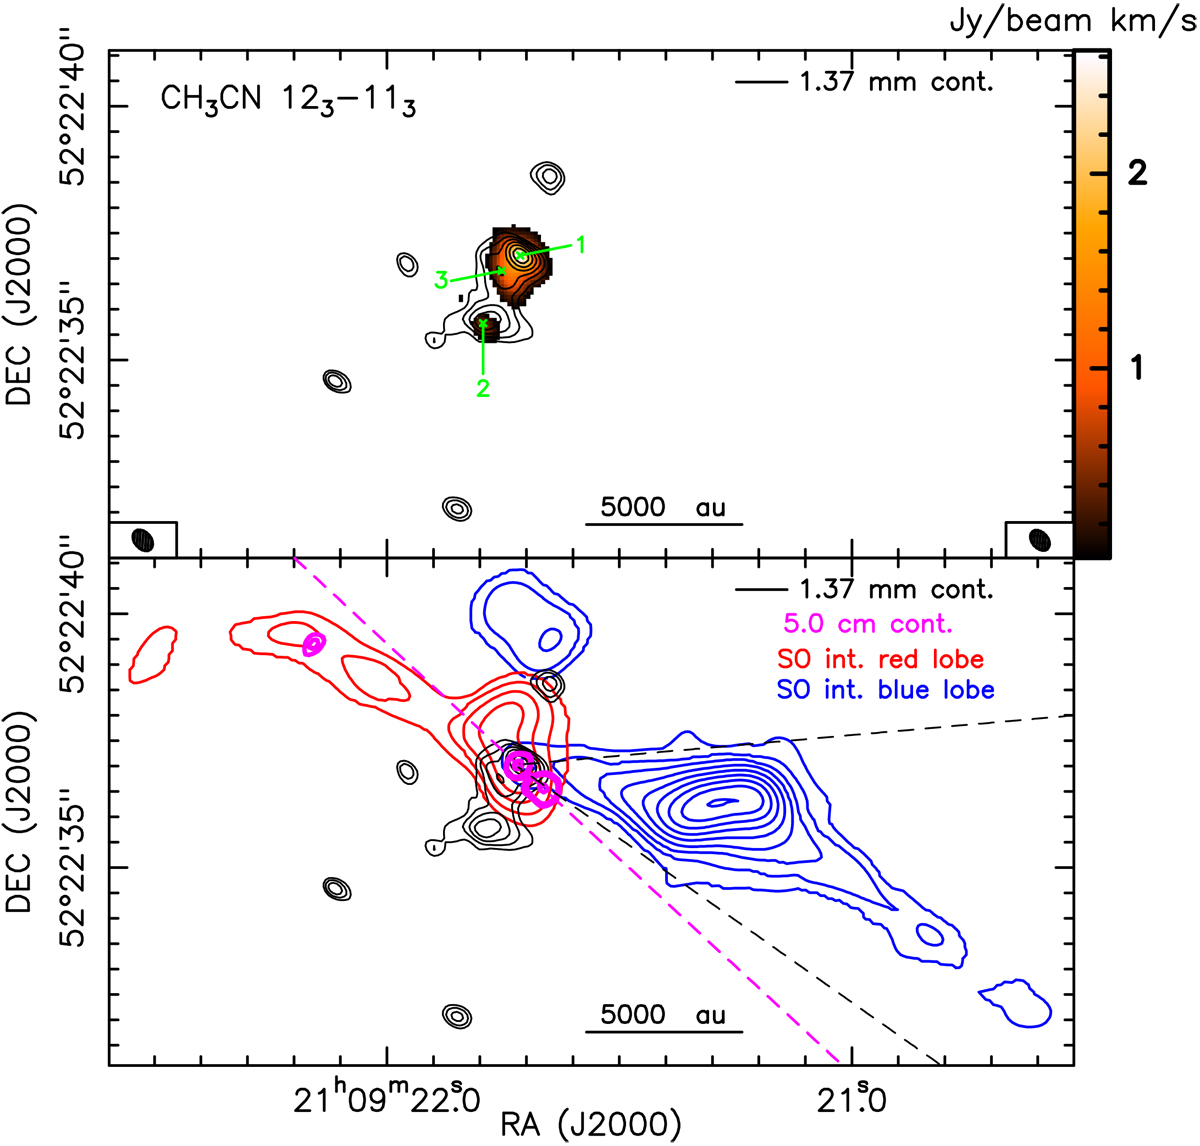
Upper panel: NOEMA data. Velocity-integrated intensity (color map) of the CH3 CN JK = 123–113 line. The 1.37 mm continuum emission is represented with black contours, showing seven levels increasing logarithmically from 11 to 35 mJy beam−1. The positions of the three strongest peaks of the 1.37 mm continuum emission are indicated, using the same labels as in Beuther et al. (2018, see Table 5). The restoring beams of the CH3 CN JK = 123–113 line and 1.37 mm continuum maps are shown in the lower right and left corners, respectively. Lower panel: the blue and red contours reproduce the emission of the SO JN = 65–54 line integrated over the velocity ranges [−22,−13] and [−1, 5] km s−1, respectively. The plotted levels are from 0.03 to 2.5 Jy beam−1, in steps of 0.27 Jy beam−1, and from 0.6 to 2.2 Jy beam−1, in steps of 0.37 Jy beam−1, for the blue- and red-shifted SO emission, respectively. The magenta contours give the JVLA A-Array continuum at 5 cm (Moscadelli et al. 2016), showing levels at 40, 50, and 90% of the peak emission of 95 μJy beam−1: the magenta dashed line connects the two strongest (nearby, but resolved) 5 cm peaks. The two black dashed lines delimit the viewing angle of the blue-shifted emission of the SO JN = 65–54 line from the NE 5 cm peak (aligned in position with core 1, see Sect. 3.1). The black contours have the same meaning as in the upper panel.
Current usage metrics show cumulative count of Article Views (full-text article views including HTML views, PDF and ePub downloads, according to the available data) and Abstracts Views on Vision4Press platform.
Data correspond to usage on the plateform after 2015. The current usage metrics is available 48-96 hours after online publication and is updated daily on week days.
Initial download of the metrics may take a while.